


Manual, Ultra High Sensitivity Aerosol Spectrometer (UHSAS)
DOC-0210 Rev E-4
4 5
© 2017 DROPLET MEASUREMENT TECHNOLOGIES
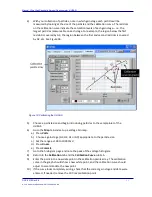
box, or click on the arrows to the left of the box. If
Forever
is selected, the instrument cycles
indefinitely. The present cycle number is shown in the gray box just above the histogram.
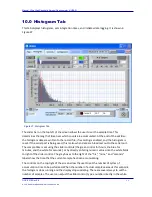
The
Run
button starts data collection and the histogram display. This button also resets the
number of samples to zero.
The
Record
button records the histogram data to a file. Clicking on this button will bring up a
browser window that allows the user to specify a file location; the default file is
C:\DMT\Spectrometer Data\YYYYMMDDhhmmss.xls
. Choosing an existing file
appends the data with a new header.
The
Cumul
button puts the histogram in cumulative mode. In this mode, the y-axis displays
particle counts from the current bin plus counts from all larger sized bins. Note that cumulative
data do not get written to the recorded data file. Cumulative mode can be entered or stopped
while a histogram is stopped or running.
The
Bin/Size
switch in the bottom left specifies whether the x-axis labels display the bin number
or the bin boundaries. Note that bin boundaries may be in mV or µsec (i.e., rather than units of
size) if volts or time have been selected as the binning criterion on the
Map
tab. Refer to the bin
map tab to identify bins, or use the cursor to read the bin boundaries which are reported at the
lower left of the page (see following section).
The control at the bottom left of the Histogram tab allows users to specify whether the y-axis
should graph counts or number concentration (counts/cm
3
).
Moving the red cursor along the x-axis allows the user to examine data from a particular bin in
more detail. Specifically, for the selected bin, the program will display the bin boundaries and
exact particle count or concentration in the fields at the bottom of the screen. On the histogram
display, a red horizontal line appears that highlights the y-axis value for the relevant bin.
To move the cursor one bin forward or backward from its current location, click on the right-
most or left-most squares in the diamond control box.
10.1 Autoscaling
The UHSAS software always autoscales the x axis. The y-axis is autoscaled by default, but can be
fixed. For a fixed y-axis, right click in the graph and uncheck the “autoscale y” option. You can
also reset the y-axis scale by typing directly into the axis labels. Do not attempt to type numbers
into the x-axis labels or select “autocale x” after right-clicking on the graph, as doing so may
interfere with the data display.


