EASY
SENSE V-Log Reference Manual
DO248 (5)
7
Data Harvest Group Ltd, 2014
2.
As an interface connected to a computer: V-Log is entirely driven by the software on the host
computer. The data from the sensors is transmitted immediately to the computer and displayed on
the computers screen using the options in the EasySense
software. This method of collection is
useful for many classroom-based experiments.
Using V-Log
standalone (without a computer)
To switch V-Log on, press any button on the panel.
Notes:
If V-Log is operating on battery power and is idle, it will automatically switch itself
off
after 2 minutes. Press any
button to resume operation.
V-Log does not auto switch off while powered from a USB port.
V-Log has a menu of different options available, which are displayed on
the built-in LCD screen.
There are six working modes, which can be used to collect data without
being connected to the computer. These are
Meter
,
Pictogram
,
Easy
Log
,
Snapshot
,
Timing
and
Counting
modes.
A menu option is selected by using the up and down buttons (
& )
to scroll the cursor until it is pointing at the required option then press
enter to select.
If using plug-in sensors they should be connected before entering a
logging mode (except for Meters when they will automatically be detected
and then display readings).
Meter
In Meter mode V-Log will display measurements from the sensors (plug-in or built-in sensors) on the LCD
screen but will not store any data.
The size of the text in Meter mode can be altered. From the
System
menu select
Meter Text
then either
Single Height
or
Double Height
. With double height selected data from up to 4
sensors is visible on the screen (scroll to see more). If single height
is selected then the data from up to 8 sensors is visible
.
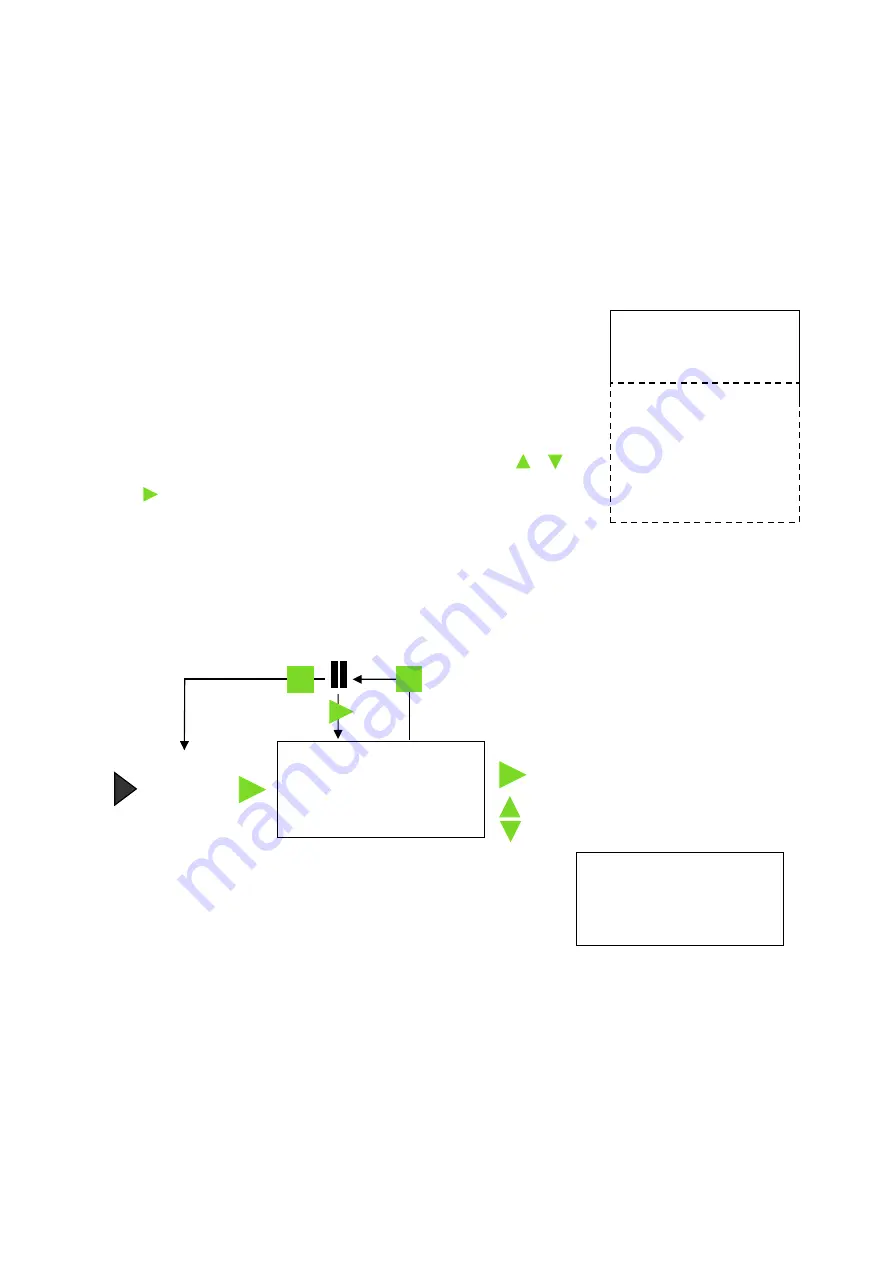
1. Connect any plug-in sensors if required. If the display is turned off, press any button to wake up the
logger
2. While in the main menu use the up or down buttons
▲▼
to scroll until the cursor is pointing at
Meter
.
Press the enter button
►
to select.
Use the up and down buttons
▲▼
to view data from the sensors.
Use the enter button
►
to check or change the sensors range or to switch a sensor off.
The stop button
will temporarily halt the updates to the sensors readings. Two lines
▌▌ (
top
left) indicate that the display is paused.
1) 23.9˚C
2) 20.5˚C
3) 24.1˚C
4) 15.6˚C
5) 50.9 dBA
6) 150 lx
7) 100.88 kPa
8) 35.9 %RH
Meter
Pictogram
EasyLog
Snapshot
Timing
Counting
Review
WiFi
System
Use the up or down buttons to scroll
and view data from the sensors
Press the enter button to switch
a sensor off or change its range
Meter
5) 50.9
dBA
6) 150
lx
7) 100.88
kPa
8) 35.9
%RH
Press stop to pause the display, then
either stop again to exit Meter mode or
enter to continue taking measurements


