


Scriptor
177
Copyright © DapTechnology B.V., 2005-2019 - All Rights Reserved., 5/20/2019
control.
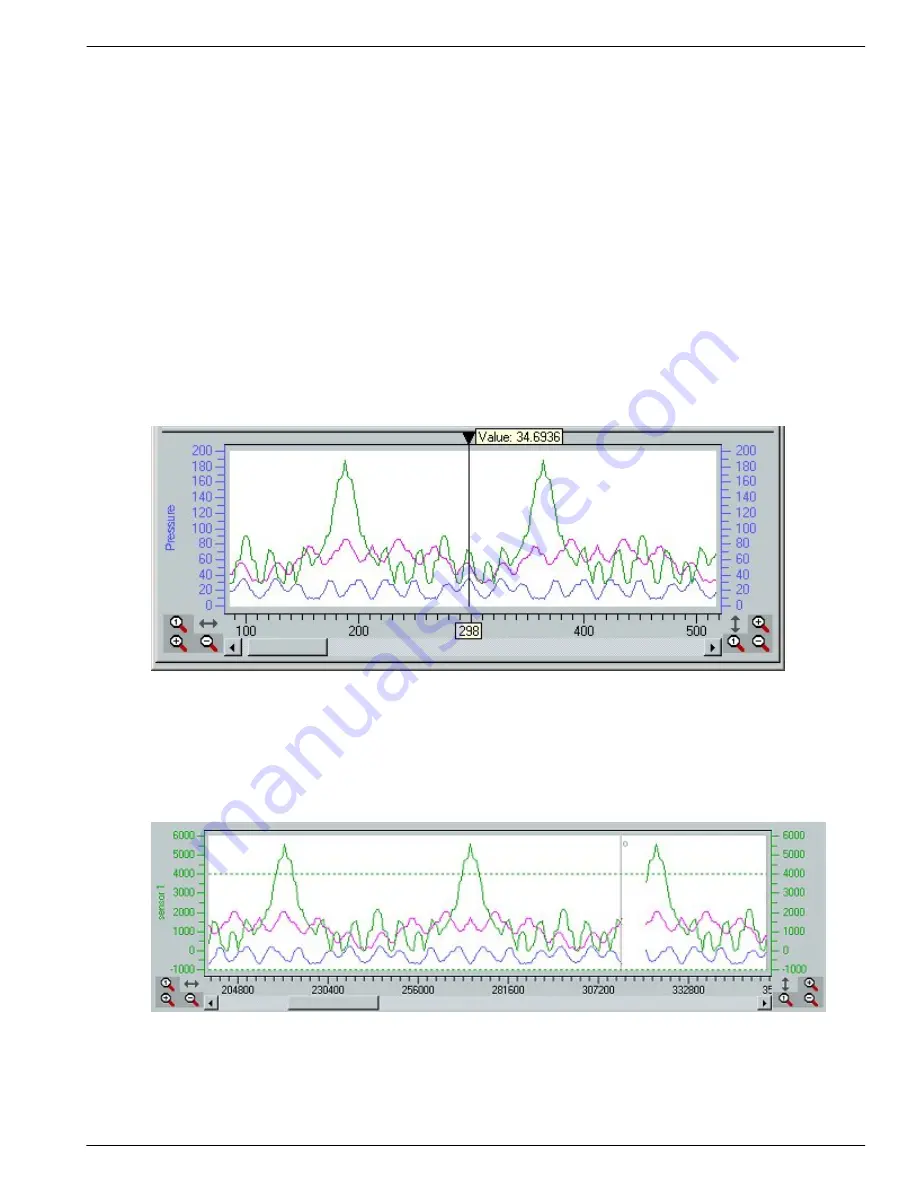
The Graph also contains a cursor, which can be used to retrieve the value at the selected time. Move the
cursor to position it exactly where you want it, this way it is easy to retrieve a maximum or minimum
value. The graphs in the plot represent the calculated values in accordance to the description of the Offset
and Factor properties. If you are interested in the "Raw" value of some point , right click on the cursor. A
popup menu enables you to select "Raw values". When enabled, the plot still draws the calculated values
but the cursor displays the "Raw" values.
When new values are added to the graph the plot normally scrolls the view automaticaly.This can be
stopped in two ways. One is by placing the cursor somewhere in the "past". The other way is by scrolling
the scrollbar to the past. Automatic scrolling is enabled again by scrolling all the way to the right or by
clicking somewhere in the "future".
When controls are added to the Control Panel, their data also becomes visible in the plot. If, at some
point, you don't want to see all graphs, right click the control you are not interested in and disable "Show
History". Note that the data is still being recorded and can be made visible again by enabling "Show
History".
The magnifying glasses on the left and right side of the bottom scrollbar enable you to zoom horizontally
and vertically. The magnify glass with the '1' inside resets the zooming to default.
The vertical-zoom function can only zoom in, but the horizontal-zoom function also enables you to zoom
out to get more data in the same plot, which makes it possible to overview data for a wider time range.
As the Analyzer stores its data in an internal buffer and the Analyzer software reads from this buffer it
might happen that overflow occurs. This is indicated in the history graph by gaps labeled with an 'O' as
can be seen in the picture below. The graph continues to plot data when the overflow situation has ended.
To prevent overflow, increase the Scriptor memory on the Memory tab of the Settings dialog.
11.3.6. Client
The Analyzer Application has support for a remote client that can view the Control Panel that is controlled
by the scriptor. The remote client can be found in the start menu.
When started it will look the same as the control panel in the Analyzer application but without the scriptor
Содержание 1394
Страница 1: ...1394 Analyzer Operation Manual Hardware and Software Guide Doc DT PRO134MAN700E ...
Страница 11: ...1394AnalyzerOperationManual 11 456 The SCSI2 Connector 457 The SUBD connector ...
Страница 187: ...Scriptor 187 Copyright DapTechnology B V 2005 2019 All Rights Reserved 5 20 2019 ...
Страница 199: ...Scriptor 199 Copyright DapTechnology B V 2005 2019 All Rights Reserved 5 20 2019 ...
Страница 363: ...FormatEditor 363 Copyright DapTechnology B V 2005 2019 All Rights Reserved 5 20 2019 ...


