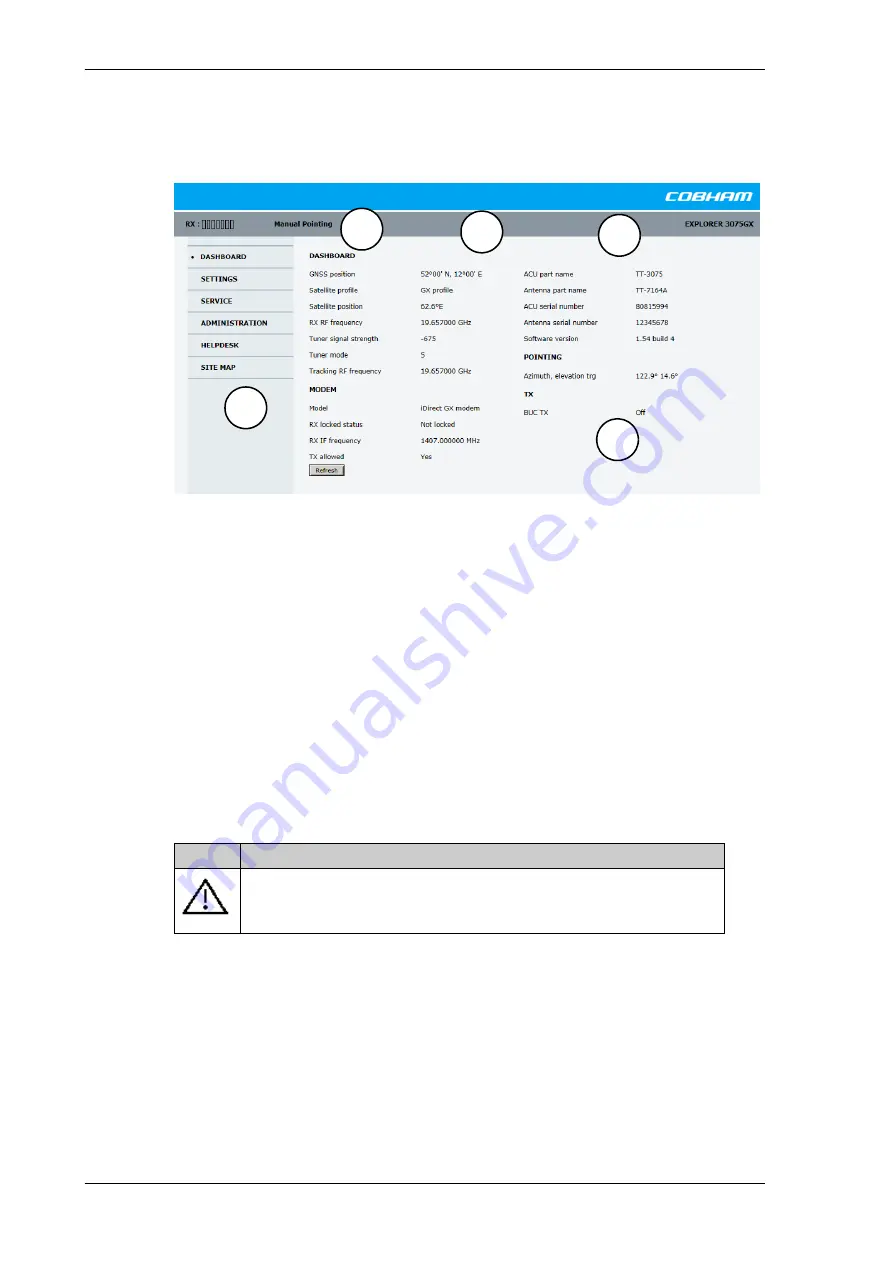
Setup with the web interface for PC
4-4
Chapter 4: Setup and operation
98-144390-C
The
DASHBOARD
is the first screen that is displayed. It shows the properties and status of
the EXPLORER 3075GX.
The web interface has the following sections:
1. The navigation pane holds the main menu. Clicking an item in the menu opens a
submenu in the navigation pane or a new page in the contents section.
2. The signal status field shows the tracking signal strength. The signal strength can vary
during operation, depending on the current position relative to the satellite.
3. The icon bar shows icons for active events, when relevant, and the system status.
4. The host name is shown on every page of the web interface. The host name is useful for
identifying the system at remote login and when requesting reports from the system.
You can change the host name, see
5. The contents section shows the page selected in the navigation pane. This section is
used for viewing or changing settings, or for performing actions.
The following icon may appear in the icon bar in the web interface:
To navigate the web interface
•
To expand a menu
, click the menu in the navigation pane.
•
To access status and settings
, click the relevant subject in the navigation pane or
click the relevant icon in the icon bar. The status or settings are displayed in the contents
section.
Figure 4-4: Web interface: DASHBOARD
Icon
Explanation
An event is active. Click the icon to see a list of active events. For
explanations of the event messages, see
on page B-2. Note
that this icon will remain in the icon bar as long as the event is active.
Table 4-1: Web interface: Event icon
1
2
3
5
4


