


Rev 6 – Feb 2022
Page 17 of 44
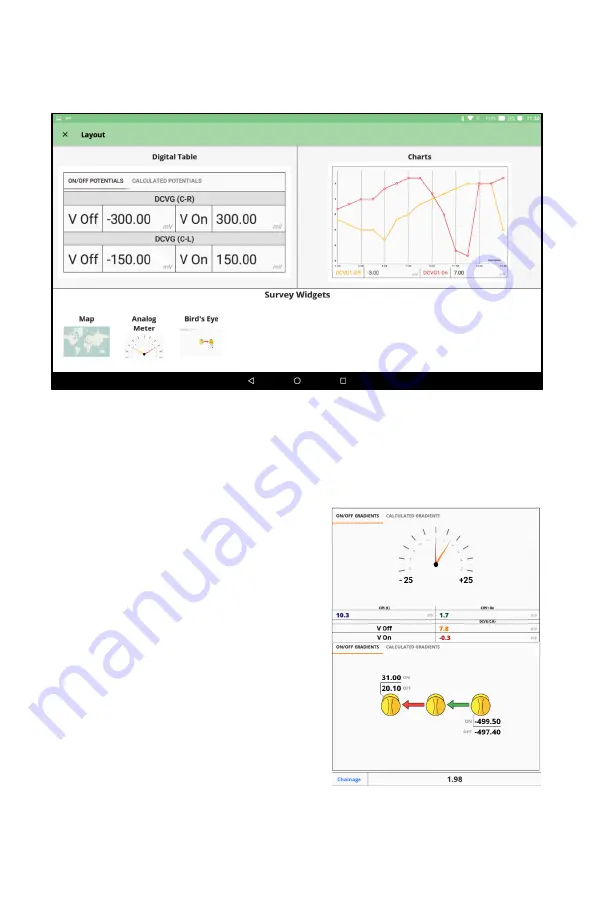
Survey Screen Settings
Survey Layout Options
The Hexcorder Pro offers five different “widgets” to use during the survey. The screen is split into
two halves which can be configured to the user’s needs. Simply touch and drag the widget you want
from the selector bar at the bottom to the location you want it and release.
•
Digital Table
– a simple table view which
shows the readings in numerical format.
(either actual or calculated)
•
Charts
– a real-time graphing view which
displays the readings as a line chart as they
are recorded. Unlike the digital table
display, the chart only shows the recorded
readings, not the real-time values. This
allows the operator to easily see trends in
the survey data.
•
Map
– an openmaps.org-based map screen
which uses the Hexcorder Pro GPS to plot
the user’s path.
•
Analog Meters
– a DCVG view using
virtual analog meters instead of digital
values, for users who prefer the analog
DCVG meters.
•
Bird’s eye view
– a DCVG view which
shows the arrangement of the survey team measurements from above. This makes it
easy for the user to see the flow of stray currents in the soil.


