background image

2-21

5. Numerical Calculations

The following explains the numerical calculation operations included in the function menu
displayed when

*

(CALC) (

(CALC) on the fx-7400G

II

) is pressed. The following

calculations can be performed.

• {

Int÷

}

/

{

Rmdr

}

/

{

Simp

} ... {quotient}/{remainder}/{simplification}

• {

Solve

}

/

{

d

/

dx

}

/

{

d

2

/

dx

2

}

/

{

°

dx

}

/

{

SolvN

} ... {equality solution}/{differential}/{quadratic differential}/

{integration}/{

f

(

x

) function solution}

• {

FMin

}

/

{

FMax

}

/

{

3

(

}

/

{

log

a

b

} ... {minimum value}/{maximum value}/{summation}/{logarithm

log

a

b}

I

 Quotient of Integer ÷ Integer 

[OPTN]

-

[CALC]

-

[Int÷]

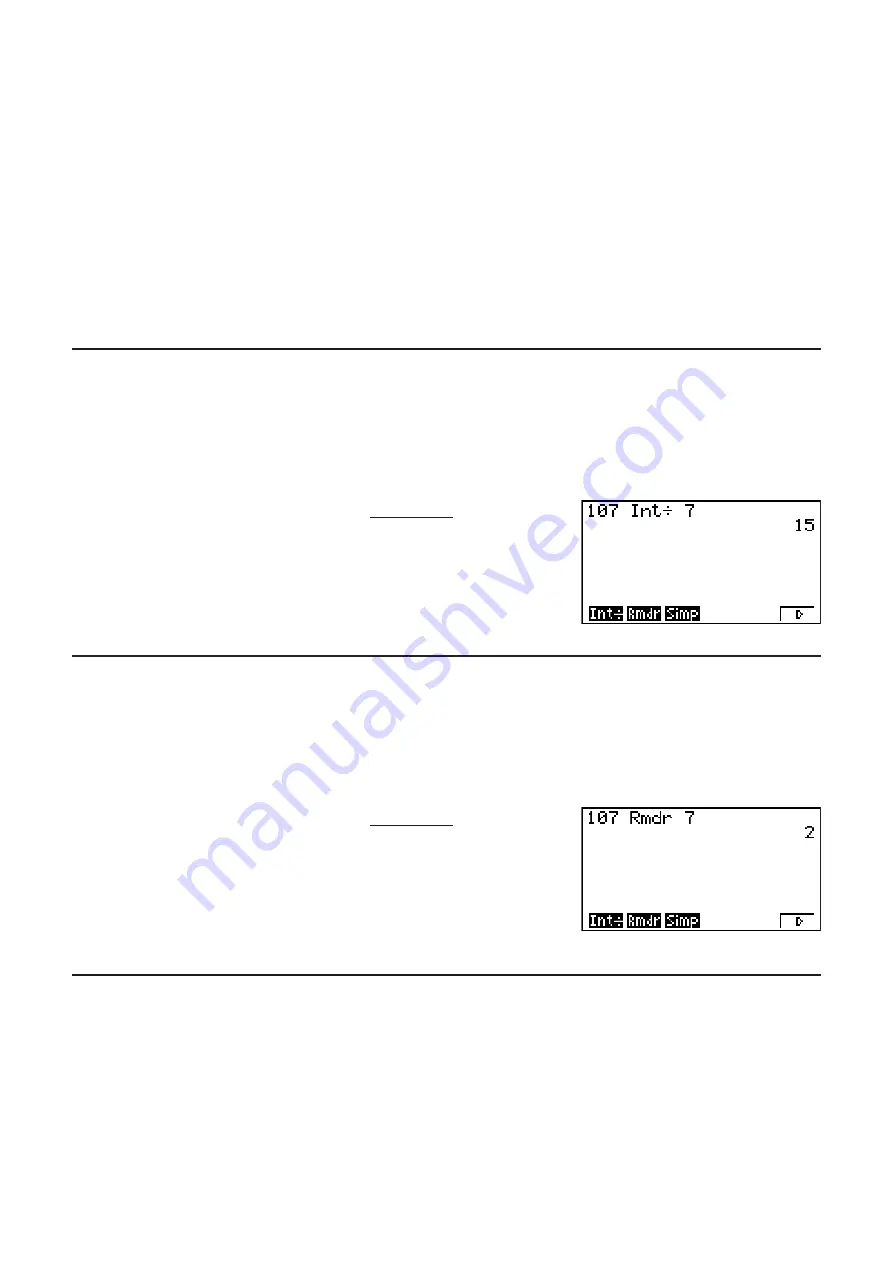
The “Int÷” function can be used to determine the quotient when one integer is divided by
another integer.

Example To calculate the quotient of 107 ÷ 7


@?F

*

(CALC)*

(

E

)


(

E

)

(Int÷)

F


U


* fx-7400G

II

:

(CALC)

I

 Remainder of Integer ÷ Integer 

[OPTN]

-

[CALC]

-

[Rmdr]

The “Rmdr” function can be used to determine the remainder when one integer is divided by
another integer.

Example To calculate the remainder of 107 ÷ 7


@?F

*

(CALC)*

(

E

)


(

E

)

(Rmdr)

F


U


* fx-7400G

II

:

(CALC)

I

 Simplification 

[OPTN]

-

[CALC]

-

[Simp]

The “

Simp” function can be used to simplify fractions manually. The following operations can

be used to perform simplification when an unsimplified calculation result is on the display.

• {

Simp

}

U

... This function automatically simplifies the displayed calculation result using the

smallest prime number available. The prime number used and the simplified result are
shown on the display.

• {

Simp

}

n

U

... This function performs simplification according to the specified divisor

n

.

Содержание FX-7400GII

Страница 1: ...SIO EDUCATIONAL FORUM http edu casio com forum fx 9860GII SD fx 9860GII fx 9860G AU PLUS fx 9860G Slim Updated to OS 2 00 fx 9860G SD Updated to OS 2 00 fx 9860G Updated to OS 2 00 fx 9860G AU Updated to OS 2 00 I ɉ I ɉ Software Version 2 00 User s Guide E ...

Страница 2: ... form without the express written consent of the manufacturer The options described in Chapter 13 of this user s guide may not be available in certain geographic areas For full details on availability in your area contact your nearest CASIO dealer or distributor Be sure to keep all user documentation handy for future reference ...

Страница 3: ...ecimal Calculations with Integers 2 33 8 Matrix Calculations 2 36 9 Mertic Conversion Calculations 2 48 Chapter 3 List Function 1 Inputting and Editing a List 3 1 2 Manipulating List Data 3 5 3 Arithmetic Calculations Using Lists 3 10 4 Switching Between List Files 3 13 Chapter 4 Equation Calculations 1 Simultaneous Linear Equations 4 1 2 High order Equations from 2nd to 6th Degree 4 2 3 Solve Cal...

Страница 4: ...in 7 10 8 Day Date Calculations 7 11 9 Depreciation 7 12 10 Bond Calculations 7 14 11 Financial Calculations Using Functions 7 16 Chapter 8 Programming 1 Basic Programming Steps 8 1 2 PRGM Mode Function Keys 8 2 3 Editing Program Contents 8 3 4 File Management 8 5 5 Command Reference 8 7 6 Using Calculator Functions in Programs 8 21 7 PRGM Mode Command List 8 37 8 Program Library 8 42 Chapter 9 Sp...

Страница 5: ... 9860GⅡ SD only 1 Using an SD Card 14 1 2 Formatting an SD Card 14 3 3 SD Card Precautions during Use 14 3 Appendix 1 Error Message Table A 1 2 Input Ranges A 5 E CON2 Application 1 E CON2 Overview 2 Using the Setup Wizard 3 Using Advanced Setup 4 Using a Custom Probe 5 Using the MULTIMETER Mode 6 Using Setup Memory 7 Using Program Converter 8 Starting a Sampling Operation 9 Using Sample Data Memo...

Страница 6: ...put output mode Note the following points if you are using an fx 9860Gɉ SD fx 9860Gɉ or fx 9860G AU PLUS For information about switching between the Math input output mode and Linear input output mode see the explanation of the Input Output mode setting under Using the Setup Screen page 1 26 For information about input and display using the Math input output mode see Using the Math Input Output Mo...

Страница 7: ...ions to change to another menu page are not shown in menu title key operations S Command List The PRGM Mode Command List page 8 37 provides a graphic flowchart of the various function key menus and shows how to maneuver to the menu of commands you need Example The following operation displays Xfct VARS FACT Xfct S E CON2 This manual does not cover the E CON2 mode For more information about the E C...

Страница 8: ... 14 2 14 5 28 5 30 5 1 5 24 1 25 1 26 1 2 1 22 1 23 1 2 2 14 2 13 2 13 2 13 2 1 1 12 1 18 2 19 2 1 2 6 2 30 1 11 1 19 2 19 2 19 1 16 1 6 2 1 2 1 2 9 2 1 1 6 1 15 2 1 1 9 2 13 2 7 1 8 2 41 1 30 1 9 3 2 2 30 10 11 10 9 Page Page Page Page Page Page Page Page Page Page Page 2 1 5 29 5 5 5 3 2 14 1 18 2 14 1 2 2 7 2 14 2 14 5 28 5 30 5 1 5 24 1 25 1 26 1 2 1 22 1 23 1 2 2 14 2 13 2 13 2 13 2 1 1 12 1 ...

Страница 9: ...tion Red Press and then the key to perform the marked function Alpha Lock Normally once you press and then a key to input an alphabetic character the keyboard reverts to its primary functions immediately If you press and then the keyboard locks in alpha input until you press again 2 Display I Selecting Icons This section describes how to select an icon in the Main Menu to enter the mode you want S...

Страница 10: ...a in a notebook like interface Use this mode when you want to store text or formulas or built in application data in a file S SHT 2 Spreadsheet Use this mode to perform spreadsheet calculations Each file contains a 26 column 999 line spreadsheet In addition to the calculator s built in commands and S SHT mode commands you can also perform statistical calculations and graph statistical data using t...

Страница 11: ...ess the menus and commands in the menu bar along the bottom of the display screen You can tell whether a menu bar item is a menu or a command by its appearance I About Display Screens This calculator uses two types of display screens a text screen and a graph screen The text screen can show 21 columns and 8 lines of characters with the bottom line used for the function key menu The graph screen us...

Страница 12: ...y Formats This calculator uses special display formats to indicate fractions hexadecimal values and degrees minutes seconds values S Fractions Indicates 456 12 23 S Hexadecimal Values Indicates 0ABCDEF1 16 which equals 180150001 10 S Degrees Minutes Seconds Indicates 12 34 56 78 In addition to the above this calculator also uses other indicators or symbols which are described in each applicable se...

Страница 13: ...laces the text at the current cursor location You can toggle between insert and overwrite by performing the operation INS The cursor appears as I for insert and as for overwrite 1 With all models except the fx 7400Gɉ fx 9750Gɉ insert and overwrite switzng is possible only when the Linear input output mode page 1 29 is selected S To change a step Example To change cos60 to sin60 AE BBB Q S To delet...

Страница 14: ...perform the following two calculations 4 12 s 6 4 26 368 4 12 s 7 1 29 252 C A E CU BBBB INS F U After you press you can press D or A to recall previous calculations in sequence from the newest to the oldest Multi Replay Function Once you recall a calculation you can use C and B to move the cursor around the calculation and make changes in it to create a new calculation Example 2 AB CDEU ABC DEFU ...

Страница 15: ...or Copy and Paste in the Math Input Output Mode page 1 18 S To specify the copy range 1 Move the cursor I to the beginning or end of the range of text you want to copy and then press G CLIP This changes the cursor to 2 Use the cursor keys to move the cursor and highlight the range of text you want to copy 3 Press COPY to copy the highlighted text to the clipboard and exit the copy range specificat...

Страница 16: ...t S To use the Catalog to input a command 1 Press C CATALOG to display an alphabetic Catalog of commands The screen that appears first is the last one you used for command input With the fx 9860G Slim the first two lines of explanation text for the currently selected command will appear at the bottom of the screen Pressing HELP will display a full screen view of the text for reading If the text do...

Страница 17: ...nd display of certain functions just as they appear in your textbook The operations in this section all are performed in the Math input output mode The initial default setting for the fx 9860Gɉ SD fx 9860Gɉ fx 9860G AU PLUS is the Math input output mode If you have changed to the Linear input output mode switch back to the Math input output mode before performing the operations in this section See...

Страница 18: ... Value Input from MATH menu 2 6 Linear Differential 3 Input from MATH menu 2 7 Quadratic Differential Differential 3 Input from MATH menu 2 7 Integral 3 Input from MATH menu 2 8 3 Calculation 4 Input from MATH menu 2 11 Matrix Input from MATH menu 2 14 5 Parentheses and 1 Braces Used during list input and 1 Brackets Used during matrix input and 1 1 Mixed fraction is supported in the Math input out...

Страница 19: ...t of absolute value X d dx starts natural input of linear differential dx d f x x a d2 dx2 starts natural input of quadratic differential dx2 d2 f x x a dx starts natural input of integral f x dx a b 3 starts natural input of 3 calculation f x x A B A 3 S Math Input Output Mode Input Examples This section provides a number of different examples showing how the MATH function menu and other keys can...

Страница 20: ...1 13 D C V U Example 3 To input 1 x 1dx 0 1 MATH E dx T C D C U Example 4 To input 2 1 2 2 1 2 2 A MATH MAT 2 2 6 AA CC V AC ...

Страница 21: ...sing Values and Expressions as Arguments A value or an expression that you have already input can be used as the argument of a function After you have input 2 3 for example you can make it the argument of resulting in 2 3 Example 1 Move the cursor so it is located directly to the left of the part of the expression that you want to become the argument of the function you will insert 2 Press INS Thi...

Страница 22: ...asically the same as those for the Linear input output mode For more information see Editing Calculations page 1 6 Note however that the following points are different between the Math input output mode and the Linear input output mode Overwrite mode input that is available in the Linear input output mode is not supported by the Math input output mode In the Math input output mode input is always ...

Страница 23: ... UNDO to cancel a cursor key operation If you press C during input and then press UNDO the cursor will return to where it was before you pressed C The UNDO operation is disabled while the keyboard is alpha locked Pressing UNDO while the keyboard is alpha locked will perform the same delete operation as the key alone Example 6 C UNDO A UNDO I Math Input Output Mode Calculation Result Display Fracti...

Страница 24: ...e result and the calculation that produced it The multiplication sign cannot be omitted immediately before an improper fraction or mixed fraction Be sure to always input a multiplication sign in this case Example 2 2 5 A A6D A V or x 1 key operation cannot be followed immediately by another V or x 1 key operation In this case use parentheses to keep the key operations separate Example 32 1 BV x 1 ...

Страница 25: ...clipboard contents at another location In the Math input output mode you can specify only one line as the copy range The CUT operation is supported for the Linear input output mode only It is not supported for the Math input output mode S To copy text 1 Use the cursor keys to move the cursor to the line you want to copy 2 Press G CLIP The cursor will change to 3 Press CPY L to copy the highlighted...

Страница 26: ...specify the dimensions size of a matrix 1 In the RUN MAT mode press K SET UP Math 2 Press MATH to display the MATH menu 3 Press MAT to display the following menu 2s2 inputs a 2 2 matrix 3s3 inputs a 3 3 matrix msn inputs an m row n column matrix up to 6 6 Example To create a 2 row s 3 column matrix msn Specify the number of rows AU Specify the number of columns BU U S To input cell values Example ...

Страница 27: ...ay format Modes that support input of expressions as they are written in textbooks RUN MAT e ACT GRAPH DYNA TABLE RECUR EQUA SOLV Modes that support natural display format RUN MAT e ACT EQUA The following explanations show Math input output mode operations in the GRAPH DYNA TABLE RECUR and EQUA modes and natural calculation result display in the EQUA mode See the sections that cover each calculati...

Страница 28: ...tings are configured on the View Window KGRAPHTV6 V A CC T6 V ACC U DRAW Example 2 In the GRAPH mode input the function y x2 x 1dx x 4 1 2 1 0 and then graph it Make sure that initial default settings are configured on the View Window KGRAPH CALC dx 6CCTV 6AC T C CTU DRAW Math Input Output Mode Input and Result Display in the EQUA Mode You can use the Math input output mode in the EQUA mode for in...

Страница 29: ... the RUN MAT or RUN or PRGM mode is selected Item names below that are marked with an asterisk are not included on the fx 7400Gɉ LIST list function menu MAT matrix operation menu CPLX complex number calculation menu CALC functional analysis menu STAT paired variable statistical estimated value menu fx 7400Gɉ menu for paired variable statistical estimated value distribution standard deviation varia...

Страница 30: ...ue 1 pitch 1 The dot value indicates the display range Xmax value Xmin value divided by the screen dot pitch 126 The dot value is normally calculated automatically from the minimum and maximum values Changing the dot value causes the maximum to be calculated automatically S FACT Recalling zoom factors Xfct Yfct x axis factor y axis factor S STAT Recalling statistical data X single variable paired ...

Страница 31: ...val upper limit right edge estimated sample proportion estimated proportion of sample 1 estimated proportion of sample 2 degrees of freedom DIST distribution calculation results p xInv x1Inv x2Inv zLow zUp tLow tUp probability distribution or cumulative distribution calculation result p value inverse Student t C2 F binomial Poisson geometric or hypergeometric cumulative distribution calculation re...

Страница 32: ...ough six unknowns 3 P Rlt P Cof matrix of solution coefficients for a quadratic or cubic equation 1 Coefficients and solutions are stored automatically in Matrix Answer Memory MatAns 2 The following conditions cause an error When there are no coefficients input for the equation When there are no solutions obtained for the equation 3 Coefficient and solution memory data for a linear equation cannot...

Страница 33: ...nt The following procedure shows how to change a setup S To change a mode setup 1 Select the icon you want and press U to enter a mode and display its initial screen Here we will enter the RUN MAT or RUN mode 2 Press K SET UP to display the mode s Setup screen This Setup screen is just one possible example Actual Setup screen contents will differ according to the mode you are in and that mode s cu...

Страница 34: ...display On Off display on display off while Graph to Table Table Graph and Trace are being used S Angle default angle unit Deg Rad Gra degrees radians grads S Complex Mode Real calculation in real number range only a bi r Ƨ rectangular format polar format display of a complex calculation S Coord graph pointer coordinate display On Off display on display off S Grid graph gridline display On Off dis...

Страница 35: ...pecification S Sketch Line overlaid line type normal thick broken dotted S Dynamic Type dynamic graph type Cnt Stop non stop continuous automatic stop after 10 draws S Locus dynamic graph locus mode On Off locus drawn locus not drawn S Y Draw Speed dynamic graph draw speed Norm High normal high speed S Variable table generation and graph draw settings RANG LIST use table range use list data S 3 Di...

Страница 36: ...n the fx 7400Gɉ fx 9750Gɉ S Input Output input output mode Math Line 1 Math Linear input output mode S Auto Calc spreadsheet auto calc On Off execute not execute the formulas automatically S Show Cell spreadsheet cell display mode Form Val formula 2 value S Move spreadsheet cell cursor direction 3 Low Right move down move right 1 The initial default setting of the fx 9860G Slim OS 2 00 fx 9860G SD...

Страница 37: ...n the fx 7400Gɉ RCL 2 Enter a capture memory number in the range of 1 to 20 and then press U This displays the image stored in the capture memory you specified 3 To exit the image display and return to the screen you started from in step 1 press You can also use the RclCapt command in a program to recall a screen image from capture memory 10 When you keep having problems If you keep having problem...

Страница 38: ...you want to delete all data currently in calculator memory and return all mode settings to their initial defaults Before performing the reset operation first make a written copy of all important data For details see Reset page 12 3 I Low Battery Message If the following message appears on the display immediately turn off the calculator and replace batteries as instructed If you continue using the ...

Страница 39: ...mber of Significant Digits Normal Display Range SET UP Display Fix Sci Norm Even after you specify the number of decimal places or the number of significant digits internal calculations are still performed using a 15 digit mantissa and displayed values are stored with a 10 digit mantissa Use Rnd of the Numeric Calculation Menu NUM page 2 12 to round the displayed value off to the number of decimal...

Страница 40: ...II NUM I Calculation Priority Sequence This calculator employs true algebraic logic to calculate the parts of a formula in the following order Type A functions Coordinate transformation Pol x y Rec r Q Functions that include parentheses such as derivatives integrations 3 etc d dx d2 dx2 dx 3 Solve FMin FMax ListmMat Fill Seq SortA SortD Min Max Median Mean Augment MatmList P Q R t RndFix logab Com...

Страница 41: ...ite function can consist of up to five functions Example 2 3 s log sin2P2 6 8 22 07101691 angle unit Rad You cannot use a differential quadratic differential integration 3 maximum minimum value Solve RndFix or logab calculation expression inside of a RndFix calculation term When functions with the same priority are used in series execution is performed from right to left ex In 120 m ex In 120 Othe...

Страница 42: ...a common denominator calculation result still may be displayed using the format even when coefficients a c d are outside the corresponding range of coefficients a c d Example 3 11 2 10 10 3 11 2 110 Calculation Examples This calculation Produces this type of display 2 s 3 2 5 6 4 5 format 35 2 s 3 148 492424 105 2 1 Decimal format 150 2 25 8 485281374 1 23 s 5 2 3 35 32566285 115 46 3 1 Decimal fo...

Страница 43: ...tion result may be displayed in decimal format even if these conditions are met Calculation Examples This calculation Produces this type of display 78P s 2 156P P format 123456P s 9 3490636 164 11111104 P 3 Decimal format 105 568 824 P 105 71 103 P P format 2 258 3238 P 6 533503684 129 1619 2 4 Decimal format 3 Decimal format because calculation result integer part is 106 or greater 4 Decimal form...

Страница 44: ...bytes to input functions and commands is different in the Linear input output mode and the Math input output mode For details about the number of bytes required for each function in the Math input output mode see page 1 11 2 Special Functions I Calculations Using Variables Example Operation Display 193 2 T A U 193 2 193 2 23 8 4 T A 23U 8 4 193 2 28 6 9 T A 28U 6 9 I Memory S Variables Alpha Memor...

Страница 45: ...rguments For details about string operations see Strings page 8 18 Example To assign string ABC to Str 1 and then output Str 1 to the display A LOCK T A J B C Releases Alpha Lock E Str U Str U fx 7400GII Str String is displayed justified left Perform the above operation in the Linear input output mode It cannot be performed in the Math input output mode S Function Memory OPTN FMEM Function memory ...

Страница 46: ... also use to store a function in function memory in a program In this case you must enclose the function inside of double quotation marks S To recall a function Example To recall the contents of function memory number 1 E E FMEM RCL U fx 7400GII FMEM The recalled function appears at the current location of the cursor on the display S To recall a function as a variable B T A U J B U E E FMEM fn AU ...

Страница 47: ...ents are not cleared when you press the key or when you switch power off S To use the contents of the answer memory in a calculation Example 123 456 579 789 579 210 AB CDEU FGH Ans U fx 7400GII fx 9750GII users The answer memory contents are not changed by an operation that assigns values to Alpha memory such as D J B U fx 9860GII SD fx 9860GII fx 9860G AU PLUS fx 9860G Slim users In the Math inpu...

Страница 48: ...n key for the angle unit you want to specify then press Deg Rad Gra degrees radians grads The relationship between degrees grads and radians is shown below 360 2P radians 400 grads 90 P 2 radians 100 grads I Setting the Display Format SET UP Display 1 On the Setup screen highlight Display 2 Press the function key for the item you want to set then press Fix Sci Norm Eng fixed number of decimal plac...

Страница 49: ...E is on the display while engineering notation is in effect You can use the following symbols to convert values to engineering notation such as 2 000 2 103 m 2k E Exa s 1018 m milli s 10 3 P Peta s 1015 M micro s 10 6 T Tera s 1012 n nano s 10 9 G Giga s 109 p pico s 10 12 M Mega s 106 f femto s 10 15 k kilo s 103 The engineering symbol that makes the mantissa a value from 1 to 1000 is automatical...

Страница 50: ...nd rounds off the value used for internal calculations to 10 significant digits to match the value in the answer memory or to the number of decimal places Fix and number of significant digits Sci specified by you Intg select this item and input a value to obtain the largest integer that is not greater than the value RndFi rounds off the value used for internal calculations to specified digits 0 to...

Страница 51: ...ation To convert 4 25 rad to degrees 243 5070629 K SET UP AAAAAA Deg 4 25 E ANGL r U 47 3 82 5rad 4774 20181 47 3 82 5 E ANGL r U 2 20 30 39 30 3 00 00 2 E ANGL 20 30 0 39 30 U 2 255 2 15 18 2 255 E ANGL E DMS U fx 7400GII fx 9750GII AAAAA fx 7400GII ANGL I Trigonometric and Inverse Trigonometric Functions Be sure to set the angle unit before performing trigonometric function and inverse trigonome...

Страница 52: ...t output mode 2 3 2 64 Math input output mode 232 512 This is because the Math input output mode internally treats the above input as 2 3 2 I Hyperbolic and Inverse Hyperbolic Functions Be sure to specify Comp for Mode in the Setup screen Example Operation sinh 3 6 18 28545536 E HYP sinh 3 6U cosh 1 20 15 0 7953654612 E HYP cosh 1 20 15 U fx 7400GII HYP I Other Functions Be sure to specify Comp fo...

Страница 53: ...returned if nothing is input for a Entering an integer of 1 through 9 for a will return the corresponding sequential random number Executing the function Ran 0 initializes the sequences of both Ran and RanList The sequence also is initialized when a sequential random number is generated with a different sequence of the previous execution using Ran or RanList or when generating a random number Ran ...

Страница 54: ...en two specified integers RanInt A B n A B A B 1E10 B A 1E10 1 n 999 A is the start value and B is the end value Omitting a value for n returns a generated random number as is Specifying a value for n returns the specified number of random values in list form Example Operation RanInt 1 5 Generates one random integer from 1 and 5 E PROB RAND Int 1 5 U RanInt 1 10 5 Generates five random integers fr...

Страница 55: ...s n and probability p RanBin n p m 1 n 100000 1 m 999 0 p 1 Omitting a value for m returns a generated random number as is Specifying a value for m returns the specified number of random values in list form Example Operation RanBin 5 0 5 Randomly produces the number of heads that can be expected in accordance with binomial distribution for five coin tosses where the probability of heads is 0 5 E P...

Страница 56: ...00GII PROB Example 2 To calculate the possible number of different combinations of 4 items that can be selected from among 10 items Formula Operation 10C4 210 10 E PROB nCr 4U fx 7400GII PROB I Greatest Common Divisor GCD Least Common Multiple LCM Example Operation To determine the greatest common divisor of 28 and 35 GCD 28 35 7 E NUM E GCD 28 35 U To determine the least common multiple of 9 and ...

Страница 57: ... 4U 1 1 2578 4572 6 066202547 s 10 4 2 1 2578 1 4572U 1 2 s 0 5 0 25 3 1 2 5U 1 Fractions can be converted to decimal values and vice versa 2 When the total number of characters including integer numerator denominator and delimiter marks exceeds 10 the fraction is automatically displayed in decimal format 3 Calculations containing both fractions and decimals are calculated in decimal format Pressi...

Страница 58: ...R logical NOT logical XOR Be sure to specify Comp for Mode in the Setup screen Example What is the logical AND of A and B when A 3 and B 2 A AND B 1 Operation Display 3 T A U 2 J B U T A E E LOGIC And J B U 1 fx 7400GII LOGIC S About Logical Operations A logical operation always produces either 0 or 1 as its result The following table shows all of possible results that can be produced by AND OR an...

Страница 59: ... Example To calculate the quotient of 107 7 F CALC E E Int F U fx 7400GII CALC I Remainder of Integer Integer OPTN CALC Rmdr The Rmdr function can be used to determine the remainder when one integer is divided by another integer Example To calculate the remainder of 107 7 F CALC E E Rmdr F U fx 7400GII CALC I Simplification OPTN CALC Simp The Simp function can be used to simplify fractions manuall...

Страница 60: ...0GII CALC Simp U The F value is the divisor Example 2 To simplify 27 63 specifying a divisor of 9 27 63 3 7 AF EBU CALC E E Simp HU fx 7400GII CALC An error occurs if simplification cannot be performed using the specified divisor Executing Simp while a value that cannot be simplified is displayed will return the original value without displaying F I Solve Calculations OPTN CALC Solve The following...

Страница 61: ...e right side variable lower limit and upper limit all can be omitted left side right side is the expression to be solved Supported variables are A through Z r and Q When the right side is omitted solution is perform using right side 0 The variable specifies the variable within the expression to be solved for A through Z r Q Omitting a variable specification cause X to be used as the variable The l...

Страница 62: ... drawing the graph In such a case precision is sacrificed for the sake of faster drawing The tolerance value is specified the graph is drawn with the same precision obtained when you normally perform a differential calculation You can also omit input of the derivative point by using the following format for the differential graph Y2 d dx Y1 In this case the value of the X variable is used as the d...

Страница 63: ...tial coefficient point tol tolerance Quadratic differential calculations produce an approximate differential value using the following second order differential formula which is based on Newton s polynomial interpretation In this expression values for sufficiently small increments of h are used to obtain a value that approximates f a Example To determine the quadratic differential coefficient at t...

Страница 64: ...e as the angle unit when performing trigonometric quadratic differentials You cannot use a differential quadratic differential integration 3 maximum minimum value Solve RndFix or logab calculation expression inside of a quadratic differential calculation term With quadratic differential calculation calculation precision is up to five digits for the mantissa In the Math input output mode the tolera...

Страница 65: ...part S Negative part S 2 When minute fluctuations in integration divisions produce large fluctuations in integration values calculate the integration divisions separately divide the large fluctuation areas into smaller divisions and then add the results together Pressing during calculation of an integral while the cursor is not shown on the display interrupts the calculation Always use radians Rad...

Страница 66: ... following Use n 1 as the distance between partitions CALC E 3 K V B K D K A E U fx 7400GII CALC 3 Calculation Precautions The value of the specified variable changes during a 3 calculation Be sure to keep separate written records of the specified variable values you might need later before you perform the calculation You can use only one variable in the function for input sequence ak Input intege...

Страница 67: ...e in expressions Other variables A through Z excluding X r Ƨ are treated as constants and the value currently assigned to that variable is applied during the calculation Input of n and the closing parenthesis can be omitted Discontinuous points or sections with drastic fluctuation can adversely affect precision or even cause an error Inputting a larger value for n increases the precision of the ca...

Страница 68: ...culation is performed and the result is displayed using rectangular form Examples ln 2i 0 6931471806 1 570796327i ln 2i ln 2 Non Real ERROR 2 The display range of Ƨ depends on the angle unit set for the Angle item on the Setup screen Deg 180 Ƨ 180 Rad P Ƨ P Gra 200 Ƨ 200 Press CPLX CPLX on the fx 7400GII to display the complex calculation number menu which contains the following items i imaginary ...

Страница 69: ...x 7400GII CPLX I Complex Number Format Using Polar Form Example 2 30 s 3 45 6 75 K SET UP AAAAAA Deg A r Ƨ A T B B T CDU fx 7400GII fx 9750GII AAAAA I Absolute Value and Argument OPTN CPLX Abs Arg The unit regards a complex number in the form a bi as a coordinate on a Gaussian plane and calculates absolute value Z and argument arg Example To calculate absolute value r and argument Ƨ for the comple...

Страница 70: ...mber for the complex number 2 4i CPLX Conj A C i U fx 7400GII CPLX I Extraction of Real and Imaginary Parts OPTN CPLX ReP lmP Use the following procedure to extract the real part a and the imaginary part b from a complex number of the form a bi Example To extract the real and imaginary parts of the complex number 2 5i CPLX E ReP A D E i U Real part extraction fx 7400GII CPLX CPLX E ImP A D E i U I...

Страница 71: ...nvolve binary octal decimal and hexadecimal values You can also convert between number systems and perform bitwise operations You cannot use scientific functions in binary octal decimal and hexadecimal calculations You can use only integers in binary octal decimal and hexadecimal calculations which means that fractional values are not allowed If you input a value that includes a decimal part the c...

Страница 72: ...cimal or hexadecimal calculation SET UP Mode Dec Hex Bin Oct 1 In the Main Menu select RUN MAT or RUN 2 Press K SET UP Move the highlighting to Mode and then specify the default number system by pressing Dec Hex Bin or Oct for the Mode setting 3 Press to change to the screen for calculation input This causes a function menu with the following items to appear d o LOG DISP number system specificatio...

Страница 73: ...ple To determine the negative of 1100102 K SET UP Move the highlighting to Mode and then press Bin LOG Neg U Negative binary octal and hexadecimal values are produced by taking the binary two s complement and then returning the result to the original number base With the decimal number base negative values are displayed with a minus sign S Bitwise Operations Example To input and execute 12016 and ...

Страница 74: ...atrix transposition Matrix inversion Matrix squaring Raising a matrix to a specific power Absolute value integer part extraction fractional part extraction maximum integer calculations Inputting complex numbers in matrix elements and using complex number related functions Matrix modification using matrix commands The maximum number of rows that can be specified for a matrix is 999 and the maximum ...

Страница 75: ...es into the matrix S To specify the dimensions size of a matrix Example To create a 2 row s 3 column matrix in the area named Mat B Highlight Mat B A DIM This step can be omitted Specify the number of rows AU Specify the number of columns BU U All of the cells of a new matrix contain the value 0 Changing the dimensions of a matrix deletes its current contents If Memory ERROR remains next to the ma...

Страница 76: ...EL 3 Press Yes to delete the matrix or No to abort the operation without deleting anything S To delete all matrices 1 While the Matrix Editor is on the display press DEL A 2 Press Yes to delete all matrices in memory or No to abort the operation without deleting anything I Matrix Cell Operations Use the following procedure to prepare a matrix for cell operations 1 While the Matrix Editor is on the...

Страница 77: ...OP Swap Input the number of the rows you want to swap AUBUU S To calculate the scalar multiplication of a row Example To calculate the product of row 2 and the scalar 4 R OP sRw Input multiplier value CU Specify row number AUU A complex number also can be input as multiplier value k S To calculate the scalar multiplication of a row and add the result to another row Example To calculate the product...

Страница 78: ...ded AU Specify number of row to be added to BUU S Row Operations DEL delete row INS insert row ADD add row S To delete a row Example To delete row 2 ROW A DEL S To insert a row Example To insert a new row between rows one and two ROW A INS S To add a row Example To add a new row below row 3 ROW AA ADD ...

Страница 79: ...reating matrices and inputting matrix data Mat Mat command matrix specification MmL MatmList command assign contents of selected column to list file Aug Augment command link two matrices Iden Identity command identity matrix input Dim Dim command dimension check Fill Fill command identical cell values You can also use A Mat in place of MAT Mat S Matrix Data Input Format OPTN MAT Mat The following ...

Страница 80: ...the dimensions of an existing matrix Example 1 To check the dimensions of Matrix A MAT E Dim E Mat T A U The display shows that Matrix A consists of two rows and three columns Since the result of the Dim command is list type data it is stored in ListAns Memory You can also use Dim to specify the dimensions of the matrix Example 2 To specify dimensions of 2 rows and 3 columns for Matrix B H A B J M...

Страница 81: ...by 5 MAT Mat T A F A A G DU S To fill a matrix with identical values and to combine two matrices into a single matrix OPTN MAT Fill Aug Use the Fill command to fill all the cells of an existing matrix with an identical value and the Augment command to combine two existing matrices into a single matrix Example 1 To fill all of the cells of Matrix A with the value 3 MAT E Fill B E Mat T A U Mat T A ...

Страница 82: ...contents of column 2 of the following matrix to list 1 Matrix A 1 2 3 4 5 6 MAT MmL Mat T A A LIST List U List U I Matrix Calculations OPTN MAT Use the matrix command menu to perform matrix calculation operations S To display the matrix commands 1 From the Main Menu enter the RUN MAT mode 2 Press to display the option menu 3 Press MAT to display the matrix command menu The following describes only...

Страница 83: ...N MAT Det Example Obtain the determinant for the following matrix Matrix A 1 2 3 4 5 6 1 2 0 MAT Det Mat T A U Determinants can be obtained only for square matrices same number of rows and columns Trying to obtain a determinant for a matrix that is not square produces an error The determinant of a 2 s 2 matrix is calculated as shown below A a11 a12 a11a22 a12a21 a21 a22 The determinant of a 3 s 3 ...

Страница 84: ...OPTN MAT Rref This command finds the reduced row echelon form of a matrix Example To find the reduced row echelon form of the following matrix Matrix A MAT E Rref E Mat T A U The row echelon form and reduced row echelon form operation may not produce accurate results due to dropped digits S Matrix Inversion x 1 Example To invert the following matrix Matrix A MAT Mat T A x 1 U 1 2 3 4 5 6 1 2 3 4 5...

Страница 85: ...the formula used to invert Matrix A into inverse matrix A 1 A a b c d A 1 1 ad bc d b c a Note that ad bc x 0 S Squaring a Matrix x2 Example To square the following matrix Matrix A MAT Mat T A VU S Raising a Matrix to a Power Example To raise the following matrix to the third power Matrix A MAT Mat T A BU For matrix power calculations calculation is possible up to a power of 32766 S Determining th...

Страница 86: ...matrix calculation result is too large to fit into Matrix Answer Memory an error occurs You can use the following operation to transfer Matrix Answer Memory contents to another matrix or when Matrix Answer Memory contains a determinant to a variable MatAns m Mat A In the above A is any variable name A through Z The above does not affect the contents of Matrix Answer Memory 9 Metric Conversion Calc...

Страница 87: ... command 2 to specify the unit being converted to is a command that links the two conversion commands This command is always available at of the Conversion menu Real numbers or a list that contains real number elements only can be used as the value being converted from When values being converted from are input into a list or when list memory is specified conversion calculation is performed for ea...

Страница 88: ...US fluid ounce U S l y light year gal US gallon pc parsec gal UK UK gallon Mil 1 1000 inch pt pint in inch qt quart ft foot tsp teaspoon yd yard tbsp tablespoon fath fathom cup cup rd rod Time ns nanosecond mile mile Ms microsecond n mile nautical mile ms millisecond Area cm2 square centimeter s second m2 square meter min minute ha hectare h hour km2 square kilometer day day in2 square inch week w...

Страница 89: ...ter mg milligram Energy Work eV electron Volt g gram J Joule kg kilogram calth calorieth mton metric ton cal15 calorie 15 C oz avoirdupois ounce calIT calorieIT lb pound mass kcalth kilocalorieth slug slug kcal15 kilocalorie 15 C ton short ton short 2000lbm kcalIT kilocalorieIT ton long ton long 2240lbm l atm liter atmosphere Force Weight N newton kW h kilowatt hour lbf pound of force ft lbf foot ...

Страница 90: ... a value The screen automatically scrolls when the highlighting is located at either edge of the screen The following example is performed starting with the highlighting located at Cell 1 of List 1 1 Input a value and press U to store it in the list BU The highlighting automatically moves down to the next cell for input 2 Input the value 4 in the second cell and then input the result of 2 3 in the...

Страница 91: ...e following example shows how to add the values in each row in List 1 and List 2 and input the result into List 3 1 Use the cursor keys to move the highlighting to the name of the list where you want the calculation results to be input 2 Press and input the expression LIST List LIST List AU You can also use List in place of LIST List I Editing List Values S To change a cell value Use the cursor ke...

Страница 92: ...sage to appear 3 Press Yes to delete all the cells in the selected list or No to abort the delete operation without deleting anything S To insert a new cell 1 Use the cursor keys to move the highlighting to the location where you want to insert the new cell 2 Press E INS to insert a new cell which contains a value of 0 causing everything below it to be shifted down The cell insert operation does n...

Страница 93: ... To sort a single list Ascending order 1 While the lists are on the screen press E TOOL SRT A 2 The prompt How Many Lists appears to ask how many lists you want to sort Here we will input 1 to indicate we want to sort only one list U 3 In response to the Select List List No prompt input the number of the list you want to sort U Descending order Use the same procedure as that for the ascending orde...

Страница 94: ...ied for sorting do not have the same number of values rows 2 Manipulating List Data List data can be used in arithmetic and function calculations In addition various list data manipulation functions make manipulation of list data quick and easy You can use list data manipulation functions in the RUN MAT or RUN STAT TABLE EQUA and PRGM modes I Accessing the List Data Manipulation Function Menu All ...

Страница 95: ...ate a list by specifying the number of data items OPTN LIST Dim Use the following procedure to specify the number of data in the assignment statement and create a list number of data n LIST Dim List list number 1 26 U n 1 999 Example To create five data items each of which contains 0 in List 1 D LIST Dim List U You can view the newly created list by entering the STAT mode S To replace all data ite...

Страница 96: ...e in a list OPTN LIST Min LIST E Min E E List list number 1 26 U Example To find the minimum value in List 1 36 16 58 46 56 LIST E Min E E List U S To find which of two lists contains the greatest value OPTN LIST Max LIST E Max E E List list number 1 26 List list number 1 26 U The two lists must contain the same number of data items If they don t an error occurs The result of this operation is sto...

Страница 97: ...e frequency is indicated by List 2 75 89 98 72 67 LIST E Med E E List List A U S To combine lists OPTN LIST Aug You can combine two different lists into a single list The result of a list combination operation is stored in ListAns memory LIST E Aug E E List list number 1 26 List list number 1 26 U Example To combine the List 1 3 2 and List 2 1 9 10 LIST E Aug E E List List A U S To calculate the s...

Страница 98: ... data item The result of this operation is stored in ListAns Memory Example To calculate the percentage represented by each data item in List 1 2 3 6 5 4 LIST E E E List U S To calculate the differences between neighboring data inside a list OPTN LIST LIST E E list number 1 26 U The result of this operation is stored in ListAns Memory Example To calculate the difference between the data items in L...

Страница 99: ... they have different dimensions An error occurs whenever an operation involving any two cells generates a mathematical error I Inputting a List into a Calculation There are three methods you can use to input a list into a calculation Specification of the list number of a list created with List Editor Specification of the sub name of a list created with List Editor Direct input of a list of values ...

Страница 100: ... and use it in a calculation Specify the cell number by enclosing it inside square brackets Example To calculate the sine of the value stored in Cell 3 of List 2 Q LIST List A B U S To input a value into a specific list cell You can input a value into a specific list cell inside a list When you do the value that was previously stored in the cell is replaced with the new value you input Example To ...

Страница 101: ...ertain limitations on using lists with graphing functions I Inputting Scientific Calculations into a List You can use the numeric table generation functions in the TABLE mode to input values that result from certain scientific function calculations into a list To do this first generate a table and then use the list copy function to copy the values from the table to the list Example To use the TABL...

Страница 102: ...hing Between List Files You can store up to 26 lists List 1 to List 26 in each file File 1 to File 6 A simple operation lets you switch between list files S To switch between list files 1 From the Main Menu enter the STAT mode Press K SET UP to display the STAT mode Setup screen 2 Use A to highlight List File 3 Press FILE and then input the number of the list file you want to use Example To select...

Страница 103: ...is currently selected for input is highlighted Each time you input a coefficient the highlighting shifts in the sequence a1 m b1 m c1 m an m bn m cn m n 2 to 6 You can also input fractions and values assigned to variables as coefficients You can cancel the value you are inputting for the current coefficient by pressing at any time before you press U to store the coefficient value This returns to t...

Страница 104: ...d to 6th Degree Your calculator can be used to solve high order equations from 2nd to 6th degree Quadratic Equation ax2 bx c 0 a p 0 Cubic Equation ax3 bx2 cx d 0 a p 0 Quartic Equation ax4 bx3 cx2 dx e 0 a p 0 1 From the Main Menu enter the EQUA mode 2 Select the POLY Polynomial mode and specify the degree of the equation You can specify a degree 2 to 6 3 Sequentially input the coefficients The c...

Страница 105: ... 2x2 3x 2 0 Complex Mode Real page 1 27 Complex Mode a bi Complex Mode r Q Internal calculations are performed using a 15 digit mantissa but results are displayed using a 10 digit mantissa and a 2 digit exponent It may take considerable time for the calculation result of a high order equation of 3rd degree or higher to appear on the display An error occurs if the calculator is unable to find a sol...

Страница 106: ...lution Lft and Rgt indicate the left and right sides that are calculated using the solution 1 1 Solutions are approximated using Newton s method Lft and Rgt values are displayed for confirmation because Newton s method may produce results that are the real solution The closer the difference between the Lft and Rgt values is to zero the lower degree of error in the result Example An object thrown i...

Страница 107: ...ecify the range and other parameters of the graph See page 5 2 3 Draw the graph Example To graph y 3x2 K GRAPH BTVU DRAW or U Press to return to the screen in step 2 Graph relation list After drawing a graph you can toggle between the Graph relation list and graph screen by pressing GjT I How to draw a simple graph 2 You can store up to 20 functions in memory and then select the one you want for g...

Страница 108: ...al initial default Thick twice the thickness of Normal Broken thick broken Dot dotted When simultaneously graphing multiple inequalities you can use the Ineq Type setting on the Setup screen K SETUP to specify either of two fill ranges AND Fills areas only where the conditions of all of the graphed inequalities are satisfied This is the initial default OR Fills all areas where the conditions of th...

Страница 109: ...ch causes an error Any illegal input out of range value negative sign without a value etc causes an error When TQ max is less than TQ min TQ ptch becomes negative You can input expressions such as 2P as V Window parameters When the V Window setting produces an axis that does not fit on the display the scale of the axis is indicated on the edge of the display closest to the origin Changing the V Wi...

Страница 110: ...to display the pop up window 4 Press a number key to specify the V Window memory number for the settings you want to recall and then press U Pressing U recalls the settings in V Window Memory 1 V Win1 I Specifying the Graph Range You can define a range start point end point for a function before graphing it 1 From the Main Menu enter the GRAPH mode 2 Make V Window settings 3 Specify the function t...

Страница 111: ...rected so they are identical to the y axis values E RND Coordinate rounding Rounds the coordinate values at the current pointer location E INTG Integer Each dot is given a width of 1 which makes coordinate values integers E PRE Previous V Window parameters are returned to what they were prior to the last zoom operation Box zoom range specification 3 Use the cursor keys to move the pointer in the c...

Страница 112: ...X f y type graph Y Y YP YO Y f x Y f x YPf x YOf x inequality graph X X XP XO X f y X f y XPf y XOf y inequality graph CONV Y Y Y YP YO X X X XP XO changes the function type of the selected expression 2 Press the function key that corresponds to the graph type you want to specify I Storing Graph Functions S To store a rectangular coordinate function Y Example To store the following expression in m...

Страница 113: ...Y1 and Y2 to create composite functions for Y3 and Y4 Y1 X 1 Y2 X2 3 Assign Y1 Y2 to Y3 and Y2 Y1 to Y4 Y1 Y2 x2 3 1 x2 4 Y2 Y1 X 1 2 3 X 4 X 1 Input relations into Y3 and Y4 TYPE Y GRPH Y Y A U GRPH Y A Y U A composite function can consist of up to five functions S To assign values to the coefficients and variables of a graph function Example To assign the values 1 0 and 1 to variable A in Y AX2 ...

Страница 114: ...ge the line style of y 2x2 3 which is stored in area Y1 to Broken STYL Selects Broken S To change the type of a function 1 1 While the Graph relation list is on the display press D or A to move the highlighting to the area that contains the function whose type you want to change 2 Press TYPE CONV 3 Select the function type you want to change to Example To change the function in memory area Y1 from...

Страница 115: ...s DRAW Example To select the following functions for drawing Y1 2x2 5 r2 5 sin3Q Use the following V Window settings Xmin 5 Xmax 5 Xscale 1 Ymin 5 Ymax 5 Yscale 1 TQ min 0 TQ max P TQ ptch 2P 60 AD Select a memory area that contains a function for which you want to specify non draw SEL Specifies non draw DRAW or U Draws the graphs You can use the Setup screen settings to alter the appearance of th...

Страница 116: ...nction 1 Press GMEM RCL to display the pop up window 2 Press a number key to specify the Graph memory for the function you want to recall and then press U Pressing U recalls the graph function in Graph Memory 1 G Mem1 Recalling data from graph memory causes any data currently on the Graph relation list to be deleted 4 Storing a Graph in Picture Memory You can save up to 20 graphic images in pictur...

Страница 117: ... screen is actually drawn from a function SSub screen The graph on the sub screen is produced by copying or zooming the main screen graph You can even make different V Window settings for the sub screen and main screen S To copy the graph to the sub screen 1 From the Main Menu enter the GRAPH mode 2 On the Setup screen select G G for Dual Screen 3 Make V Window settings for the main screen Press R...

Страница 118: ...K SET UP _ AAAA G G fx 7400Gɉ fx 9750Gɉ AAA V WIN AUAU DUA AUAU U RIGHT CUCU UA BUBU U TYPE Y T T T U DRAW COPY Pressing while a graph is on the display will return to the screen in step 4 6 Manual Graphing I Rectangular Coordinate Graph Inputting the Graph command in the RUN MAT or RUN mode enables drawing of rectangular coordinate graphs 1 From the Main Menu enter the RUN MAT or RUN mode 2 Make ...

Страница 119: ...perators or values cannot be input I Drawing Multiple Graphs on the Same Screen Use the following procedure to assign various values to a variable contained in an expression and overwrite the resulting graphs on the screen 1 From the Main Menu enter the GRAPH mode 2 On the Setup screen change the Dual Screen setting to Off 3 Make V Window settings 4 Specify the function type and input the function...

Страница 120: ...screen There are two types of functions you can paste into the graph screen Type 1 Y expression A function with the Y variable to the left of the equal sign is graphed as Y expression Example To paste Y X and graph it Any spaces to the left of Y are ignored Type 2 expression Pasting this type of expression graphs Y expression Example To paste X and graph Y X Any spaces to the left of the expressio...

Страница 121: ...ting a draw without clearing graph screen memory will redraw all the graphs including those produced by pasting functions 7 Using Tables To enter the TABLE mode select the TABLE icon on the Main Menu I Storing a Function and Generating a Number Table S To store a function Example To store the function y 3x2 2 in memory area Y1 Use D and A to move the highlighting in the Table relation list to the ...

Страница 122: ...t List 6 for example press EU This causes the setting of the Variable item of the Setup screen to change to List 6 4 After specifying the list you want to use press to return to the previous screen S Generating a Table Example To generate a table of values for the functions stored in memory areas Y1 and Y3 of the Table relation list Use D and A to move the highlighting to the function you want to ...

Страница 123: ...the number key that corresponds to the function type you want to specify The number table is generated only for the function type specified on the relation list Table Func You cannot generate a number table for a mixture of different function types I Editing Tables You can use the table menu to perform any of the following operations once you generate a table Change the values of variable x Edit d...

Страница 124: ... to generate a number table and then draw a graph based on the values in the table 1 From the Main Menu enter the TABLE mode 2 Make V Window settings 3 Store the functions 4 Specify the table range 5 Generate the table 6 Select the graph type and draw it G CON line graph G PLT plot type graph After drawing the graph pressing G j T or returns to the number table screen Example Store the two functio...

Страница 125: ...e range 6 The number table is displayed in the sub screen on the right 7 Specify the graph type and draw the graph G CON line graph G PLT plot type graph Example Store the function Y1 3x2 2 and simultaneously display its number table and line graph Use a table range of 3 to 3 with an increment of 1 Use the following V Window settings Xmin 0 Xmax 6 Xscale 1 Ymin 2 Ymax 10 Yscale 2 K TABLE V WIN UEU...

Страница 126: ...ent will be the dynamic variable 2 6 Specify the start value end value and increment 7 Specify the drawing speed SPEED Pause after each draw Stop Go Half normal speed Slow Normal speed Normal Twice normal speed Fast 8 Draw the Dynamic Graph 1 The following are the seven built in function types Y AX B Y A X B 2 C Y AX2 BX C Y AX 3 BX2 CX D Y Asin BX C Y Acos BX C Y Atan BX C After you press TYPE an...

Страница 127: ...s to select the function type on the built in function type list 5 Input values for coefficients and specify which coefficient will be the dynamic variable 6 Specify the start value end value and increment 7 Specify Normal for the draw speed 8 Draw the Dynamic Graph Example Use Dynamic Graph to graph y Ax in which the value of coefficient A changes from 1 through 4 in increments of 1 The Graph is ...

Страница 128: ...Note that you can store one set of data in memory at any one time S To save data in Dynamic Graph memory 1 While a Dynamic Graph draw operation is being performed press to change to the speed adjustment menu 2 Press STO In response to the confirmation dialog that appears press Yes to save the data S To recall data from Dynamic Graph memory 1 Display the Dynamic Graph relation list 2 Pressing RCL r...

Страница 129: ...ifying On for the 3Display of the Setup screen causes the sum of each term to be included in the table I Graphing a Recursion Formula After generating a number table from a recursion formula you can graph the values on a line graph or plot type graph 1 From the Main Menu enter the RECUR mode 2 Make V Window settings 3 Specify the recursion formula type and input the formula 4 Specify the table ran...

Страница 130: ...ontal axis while the following numeric sequence is on the vertical axis 1 From the Main Menu enter the RECUR mode 2 Configure V Window settings 3 Enter two recursion formulas and select both of them for table generation 4 Configure table generation settings Specify the start and end values for variable n and the initial term for each recursion formula 5 Display the recursion formula number table 6...

Страница 131: ...enu that appears when you press PHAS on the table screen an Use numeric sequence for graphing 3an Use numeric sequence sums for graphing When On is selected 3Display on the Setup screen and all three of the expressions you input in the RECUR mode are selected for table creation use the function menu that appears when you press PHAS on the table screen to specify which two of the expressions you wa...

Страница 132: ... that resemble a spider web are drawn on the display Failure of the web lines to appear indicates either divergence or that the graph is outside the boundaries of the display screen When this happens change to larger V Window values and try again You can use DA to select the graph Example To draw the WEB graph for the recursion formula an 1 3 an 2 3an bn 1 3bn 0 2 and check for divergence or conve...

Страница 133: ...e PARM parametric 3 Select the pattern of the function in accordance with the type of graph you want to draw 1 U 4 Enter the coefficients of the function and draw the graph Example To input the rectangular coordinate function x 2y2 y 1 and graph a parabola open on the right and then input the polar coordinate function r 4cosQ and draw a circle graph KCONICS RECT A X AY2 BY C U AU U U DRAW POL AAAA...

Страница 134: ...line E Hztl Horizontal line E E PEN Freehand E E Text Text input 7 Use the cursor keys to move the pointer to the location where you want to draw and press U 3 1 The above shows the function menu that appears in the GRAPH mode Menu items may differ somewhat in other modes 2 In the case of an inverse function graph drawing starts immediately after you select this option 3 Some sketch functions requ...

Страница 135: ...he x axis of the current pointer location 5 You can also move the pointer by pressing T to display the pop up window and then inputting coordinates The pop up window appears even when you input coordinates directly To exit a trace operation press TRCE 1 The pointer is not visible on the graph when it is located at a point outside the graph display area or when an error of no value occurs You can t...

Страница 136: ...ltiple graphs on the display press D and A to select the graph you want 6 Use B and C to move the pointer and press U to store coordinates into the number table Repeat this step to store as many values as you want 7 Press CHNG to make the number table active I Coordinate Rounding This function rounds off coordinate values displayed by Trace 1 From the Main Menu enter the GRAPH mode 2 Draw the grap...

Страница 137: ...graph of the solution obtained is a point of tangency with the x axis When a solution is an inflection point I Calculating the Point of Intersection of Two Graphs Use the following procedure to calculate the point of intersection of two graphs 1 Draw the graphs 2 Press G SLV ISCT When there are three or more graphs the selection cursor I appears at the lowest numbered graph 3 Press D and A to move...

Страница 138: ...e given x coordinate value or y coordinate value Press U to calculate the corresponding y coordinate value or x coordinate value Example Graph the two functions shown below and then determine the y coordinate for x 0 5 and the x coordinate for y 2 2 on graph Y2 Y1 x 1 Y2 x x 2 x 2 When there are multiple results for the above procedure press C to calculate the next value Pressing B returns to the ...

Страница 139: ...e 2 Select the function type RECT rectangular coordinate POL polar coordinate PARM parametric 3 Use D and A to select the conic section you want to analyze 4 Input the conic section constants 5 Draw the Graph After graphing a conic section press G SLV to display the following graph analysis menus S Parabolic Graph Analysis FOCS VTX LEN e focus vertex length of latus rectum eccentricity DIR SYM dir...

Страница 140: ...i for an ellipse or hyperbolic graph press C to calculate the second focus Pressing B returns to the first focus When calculating two vertexes for a hyperbolic graph press C to calculate the second vertex Pressing B returns to the first vertex Pressing C when calculating the vertices of an ellipse will calculate the next value Pressing B will scroll back through previous values An ellipse has four...

Страница 141: ...ssion calculations to analyze the data For information about using the statistical data lists see Chapter 3 List Function I Changing Graph Parameters Use the following procedures to specify the graph draw non draw status the graph type and other general settings for each of the graphs in the graph menu GPH1 GPH2 GPH3 While the statistical data list is on the display press GRPH to display the graph...

Страница 142: ...f the plot points on the graph S To display the general graph settings screen GRPH SET Pressing GRPH SET displays the general graph settings screen StatGraph statistical graph specification GPH1 GPH2 GPH3 graph 1 2 3 Graph Type graph type specification Scat xy NPP Pie scatter diagram xy line graph normal probability plot pie graph Hist Box Bar N Dis Brkn histogram med box graph bar graph normal di...

Страница 143: ...tting is for Graph 1 GPH1 of the graph menu StatGraph2 is for Graph 2 and StatGraph3 is for Graph 3 2 Use the cursor keys to move the highlighting to the graph whose status you want to change and press the applicable function key to change the status On Off On draw Off non draw DRAW draws all On graphs 3 To return to the graph menu press V Window parameters are normally set automatically for stati...

Страница 144: ...ion accumulated ratio XList specifies the list where data is input and Mark Type is used to select from among the marks U s you want to plot Press or QUIT to return to the statistical data list I Pie Graph You can draw a pie graph based on the data in a specific list The maximum number of graph data items list lines is 20 The graph is labeled A B C and so on corresponding to lines 1 2 3 and so on ...

Страница 145: ...cify the graph type turn the Outliers item On and draw the graph Changing the Q1Q3 Type setting on the Setup screen can cause the Q1 and Q3 positions to change even when a Med box graph is drawn based on a single list I Bar Graph You can specify up to three lists for drawing a bar graph The graph is labeled 1 2 3 and so on corresponding to lines 1 2 3 and so on of the list used for the graph data ...

Страница 146: ...ve before the graph is drawn At this point you can change the Start and Width values I Displaying the Calculation Results of a Drawn Single Variable Graph Single variable statistics can be expressed as both graphs and parameter values When these graphs are displayed the single variable calculation results appear as shown to the right when you press 1VAR Use A to scroll the list so you can view the...

Страница 147: ...r point of the total population as the reference the population elements are divided into two groups a lower half group and an upper half group Q1 and Q3 then become the values described below Q1 median of the group of 2 n items from the bottom of the population Q3 median of the group of 2 n items from the top of the population Center Point Center Point Center Point When the number of elements n i...

Страница 148: ... Cumulative Frequency Cumulative Frequency Ratio 1 1 1 1 10 0 1 2 1 2 2 10 0 2 3 2 4 4 10 0 4 4 3 7 7 10 0 7 5 1 8 8 10 0 8 6 1 9 9 10 0 9 7 1 10 10 10 1 0 3 is the value of whose cumulative frequency ratio is greater than 1 4 and nearest to 1 4 so Q1 3 5 is the value of whose cumulative frequency ratio is greater than 3 4 and nearest to 3 4 so Q3 5 Reference Point 0 25 Reference Point 0 75 Median...

Страница 149: ... below Next plot the data on a scatter diagram and connect the dots to produce an xy line graph 0 5 1 2 2 4 4 0 5 2 xList 2 1 0 3 1 5 2 0 2 4 yList K STAT DU AUA CUCUD AUC A U BU DUAUA CU Scatter diagram GRPH SET A Scat GPH1 xy line graph GRPH SET A xy GPH1 Scatter diagram xy line graph I Drawing a Regression Graph Use the following procedure to input paired variable statistical data perform a reg...

Страница 150: ...ab x Pwr Sin Lgst linear regression ax b form linear regression a bx form Med Med quadratic regression cubic regression quartic regression logarithmic regression exponential regression aebx form exponential regression abx form power regression sinusoidal regression logistic regression calculation and graphing 2VAR paired variable statistical results I Displaying Regression Calculation Results When...

Страница 151: ... constant term y intercept y a bx a regression constant term y intercept b regression coefficient slope I Med Med Graph When it is suspected that there are a number of extreme values a Med Med graph can be used in place of the least squares method This is similar to linear regression but it minimizes the effects of extreme values CALC Med DRAW The following is the Med Med graph model formula y ax ...

Страница 152: ...rmula y a bX CALC E Log DRAW The following is the logarithmic regression model formula y a b ln x a regression constant term b regression coefficient I Exponential Regression Graph Exponential regression expresses y as a proportion of the exponential function of x The standard exponential regression formula is y a ebx so if we take the logarithms of both sides we get In y In a bx Next if we say Y ...

Страница 153: ... Drawing a sine regression graph causes the angle unit setting of the calculator to automatically change to Rad radians The angle unit does not change when you perform a sine regression calculation without drawing a graph Certain types of data may take a long time to calculate This does not indicate malfunction I Logistic Regression Graph Logistic regression is best applied for time based phenomen...

Страница 154: ...sum of squares of data stored in xList Sx population standard deviation of data stored in xList sx sample standard deviation of data stored in xList n number of data N mean of data stored in yList 3y sum of data stored in yList 3y2 sum of squares of data stored in yList Sy population standard deviation of data stored in yList sy sample standard deviation of data stored in yList 3xy sum of the prod...

Страница 155: ...this section are performed based on the above specifications I Single Variable Statistical Calculations In the previous example under Displaying the Calculation Results of a Drawn Single Variable Graph statistical calculation results were displayed after the graph was drawn These were numeric expressions of the characteristics of variables used in the graphic display These values can also be direc...

Страница 156: ...en Pressing CALC REG displays a function menu which contains the following items ax b a bx Med X 2 X 3 X 4 Log ae bx ab x Pwr Sin Lgst linear regression ax b form linear regression a bx form Med Med quadratic regression cubic regression quartic regression logarithmic regression exponential regression aebx form exponential regression abx form power regression sinusoidal regression logistic regressi...

Страница 157: ...log box to appear 2 Input the value you want for x and then press U This causes the coordinates for x and y to appear at the bottom of the display and moves the pointer to the corresponding point on the graph MSe 1 n 2 i 1 n yi axi b 2 MSe 1 n 2 i 1 n yi axi b 2 MSe 1 n 2 i 1 n yi a bxi 2 MSe 1 n 2 i 1 n yi a bxi 2 MSe 1 n 3 i 1 n yi axi bxi c 2 2 MSe 1 n 3 i 1 n yi axi bxi c 2 2 MSe 1 n 4 i 1 n y...

Страница 158: ... obtained as the result of a regression calculation To copy a resulting regression formula press COPY I Estimated Value Calculation After drawing a regression graph with the STAT mode you can use the RUN MAT or RUN mode to calculate estimated values for the regression graph s x and y parameters Example To perform a linear regression using the nearby data and estimate the values of ţ and ů when xi ...

Страница 159: ...ults of measurements of the height of 20 college students Determine what percentage of the students fall in the range 160 5 cm to 175 5 cm Also in what percentile does the 175 5 cm tall student fall Class no Height cm Frequency 1 158 5 1 2 160 5 1 3 163 3 2 4 167 5 2 5 170 2 3 P t Q t R t t t t 0 0 0 x P t Q t R t t t t 0 0 0 x Class no Height cm Frequency 6 173 3 4 7 175 5 2 8 178 6 2 9 180 4 2 1...

Страница 160: ...he RUN MAT or RUN mode 1 From the Main Menu enter the RUN MAT or RUN mode 2 Input the commands to draw a rectangular coordinate graph 3 Input the probability value Example To draw a normal probability P 0 5 graph K RUN MAT or RUN SKTCH Cls U GRPH Y E PROB E P D U fx 7400GII PROB I Calculations Using the Distribution Function Important The following operations cannot be performed on the fx 7400GII ...

Страница 161: ...m calculations using data you saved to a list List 1 to List 26 with the STAT mode List Editor or list data you input directly on the RUN MAT or RUN mode screen Syntax StdDev List n List m Variance List n List m List n Sample data List m Frequency data Example To store the x data below in List 1 the frequency values in List 2 and determine the standard deviation and variance x 60 70 80 90 Frequenc...

Страница 162: ...SampleZTest 1 From the Main Menu enter the RUN MAT mode 2 Perform the following key operation STAT E TEST Z 1 S A U LIST List Ans U The following calculation results are displayed as ListAns elements 1 through 4 1 z score 2 p value 3 M 4 n For details about the function of the supported TEST command and their syntax see Using the TEST Command to Execute a Command in a Program page 8 32 5 Tests Imp...

Страница 163: ...way Test tests whether the observed count of sample data fits a certain distribution For example it can be used to determine conformance with normal distribution or binomial distribution The C2 two way test creates a cross tabulation table that structures mainly two qualitative variables such as Yes and No and evaluates the independence of the variables 2 Sample F Test tests the hypothesis for the...

Страница 164: ...ation is off the graph screen Two points are displayed in the case of a two tail test Use B and C to move the pointer P Displays p value Pressing P displays the p value at the bottom of the display without displaying the pointer Executing an analysis function automatically stores the z and p values in alpha variables Z and P respectively S 1 Sample Z Test This test is used when the population stan...

Страница 165: ...he following shows the parameter data specification items that are different from list data specification Calculation Result Output Example M1xM2 direction of test sx1 Displayed only for Data List setting sx2 Displayed only for Data List setting Save Res does not save the M1 condition in line 2 S 1 Prop Z Test This test is used to test for an unknown proportion of successes The 1 Prop Z Test is ap...

Страница 166: ...lation Result Output Example p1 p2 direction of test Save Res does not save the p1 condition in line 2 I t Tests S t Test Common Functions You can use the following graph analysis functions after drawing a t Test result output graph T Displays t score Pressing T displays the t score at the bottom of the display and displays the pointer at the corresponding location in the graph unless the location...

Страница 167: ...t is applied to t distribution Perform the following key operations from the statistical data list TEST t 1 S The following shows the parameter data specification items that are different from list data specification Calculation Result Output Example Mx11 3 direction of test Save Res does not save the M condition in line 2 S 2 Sample t Test 2 Sample t Test compares the population means when the po...

Страница 168: ...sets as x y pairs and uses the method of least squares to determine the most appropriate a b coefficients of the data for the regression formula y a bx It also determines the correlation coefficient and t score and calculates the extent of the relationship between x and y Perform the following key operations from the statistical data list TEST t REG Calculation Result Output Example Bx0 Rx0 direct...

Страница 169: ... screen P Displays p value Pressing P displays the p value at the bottom of the display without displaying the pointer Executing an analysis function automatically stores the C2 and p values in alpha variables C and P respectively Ƶ2 GOF Test Ƶ2 one way Test The C2 GOF Test Ƶ2 one way test tests whether the frequency of sample data fits a certain distribution For example it can be used to determin...

Страница 170: ...counts all cells positive integers Expected name of matrix A to Z that is for saving expected frequency Calculation Result Output Example The matrix must be at least two lines by two columns An error occurs if the matrix has only one line or one column Pressing Mat while the Observed and Expected parameter settings are highlighted will display the Matrix A to Z setting screen Pressing MAT while se...

Страница 171: ...ng location in the graph unless the location is off the graph screen Two points are displayed in the case of a two tail test Use B and C to move the pointer P Displays p value Pressing P displays the p value at the bottom of the display without displaying the pointer Executing an analysis function automatically stores the F and p values in alpha variables F and P respectively Save Res does not sav...

Страница 172: ... list number in the range of 1 to 22 The following item appears in the case of Two Way ANOVA only Factor B category list List 1 to 26 After setting all the parameters use A to move the highlighting to Execute and then press one of the function keys shown below to perform the calculation or draw the graph CALC Performs the calculation DRAW Draws the graph Two Way ANOVA only Calculation results are ...

Страница 173: ...s to alpha variable A and the mean value to variable M respectively I ANOVA Two Way S Description The nearby table shows measurement results for a metal product produced by a heat treatment process based on two treatment levels time A and temperature B The experiments were repeated twice each under identical conditions Perform analysis of variance on the following null hypothesis using a significa...

Страница 174: ... so the hypothesis is not rejected Temperature differential B level of significance P 0 04222398836 The level of significance p 0 04222398836 is less than the significance level 0 05 so the hypothesis is rejected Interaction A s B level of significance P 2 78169946e 3 The level of significance p 2 78169946e 3 is less than the significance level 0 05 so the hypothesis is rejected The above test ind...

Страница 175: ...n the population standard deviation is known 2 Sample Z Interval calculates the confidence interval for the difference between two population means when the population standard deviations of two samples are known 1 Prop Z Interval calculates the confidence interval for an unknown proportion of successes 2 Prop Z Interval calculates the confidence interval for the difference between the proportion ...

Страница 176: ...t data specification Calculation Result Output Example S 2 Sample Z Interval 2 Sample Z Interval calculates the confidence interval for the difference between two population means when the population standard deviations of two samples are known Perform the following key operations from the statistical data list INTR Z 2 S S 1 Prop Z Interval 1 Prop Z Interval uses the number of data to calculate t...

Страница 177: ...erform the following key operations from the statistical data list INTR Z 2 P I t Interval S 1 Sample t Interval 1 Sample t Interval calculates the confidence interval for an unknown population mean when the population standard deviation is unknown Perform the following key operations from the statistical data list INTR t 1 S The following shows the parameter data specification items that are diff...

Страница 178: ...lished as the criteria you can calculate normal probability when estimating what percent of the products meet the criteria Conversely a success rate target 80 for example is set up as the hypothesis and normal distribution is used to estimate the proportion of the products will reach this value Normal probability density calculates the probability density of normal distribution from a specified x ...

Страница 179: ...y after a Normal Probability Density Student t Probability Density Ƶ2 Probability Density or F Probability Density graph is drawn The following is the general procedure for using the P CAL function 1 After drawing a distribution graph press G SLV P CAL to display the x value input dialog box 2 Input the value you want for x and then press U This causes the x and p values to appear at the bottom of...

Страница 180: ...bility of a normal distribution between a lower bound and an upper bound Calculation Result Output Examples When a list is specified Graph when an x value is specified Graphing is supported only when a variable is specified and a single x value is entered as data Inverse Normal Cumulative Distribution DIST NORM InvN Inverse Normal Cumulative Distribution calculates the boundary value s of a normal...

Страница 181: ...tudent t Probability Density DIST t tPd Student t Probability Density calculates the probability density p for a specified single x value or a list When a list is specified calculation results for each list element are displayed in list form Calculation Result Output Examples When a list is specified Graph when variable x is specified Graphing is supported only when a variable is specified and a s...

Страница 182: ...dent t Cumulative Distribution I Ƶ2 Distribution Ƶ2 Probability Density DIST CHI CPd Ƶ2 Probability Density calculates the Ƶ2 probability density p for a specified single x value or a list When a list is specified calculation results for each list element are displayed in list form Calculation Result Output Examples When a list is specified Graph when variable x is specified Graphing is supported ...

Страница 183: ...om value Calculation Result Output Examples When a list is specified When variable x is specified There is no graphing for Inverse Ƶ2 Cumulative Distribution I F Distribution F Probability Density DIST F FPd F Probability Density calculates the F probability density p for a specified single x value or a list When a list is specified calculation results for each list element are displayed in list f...

Страница 184: ...ower bound value of an F cumulative distribution probability for specified n df and d df degrees of freedom of numerator and denominator values Calculation Result Output Examples When a list is specified When variable x is specified There is no graphing for Inverse F Cumulative Distribution I Binomial Distribution Binomial Probability DIST BINM BPd Binomial Probability calculates a probability at ...

Страница 185: ...efore a specified trial Calculation Result Output Examples When a list is specified When variable x is specified There is no graphing for Binomial Cumulative Distribution Inverse Binomial Cumulative Distribution DIST BINM InvB Inverse Binomial Cumulative Distribution calculates the minimum number of trials of a binomial cumulative distribution for specified values Calculation Result Output Example...

Страница 186: ...lative Distribution are integers Accuracy may be reduced when the first argument has 10 or more digits Note that even a slight difference in calculation accuracy affects calculation results If a warning message appears check the displayed values I Poisson Distribution Poisson Probability DIST E POISN PPd Poisson Probability calculates a probability at a specific single x value or each list element...

Страница 187: ...cant digits Area value to calculate minimum number of trials values The results are assigned to system variables xInv calculation result using Area and xInv calculation result using Area The calculator always displays the xInv value only However when the xInv and xInv values are different the message will appear with both values The calculation results of Inverse Poisson Cumulative Distribution ar...

Страница 188: ...a specified trial Calculation Result Output Examples When a list is specified When variable x is specified There is no graphing for Geometric Cumulative Distribution Inverse Geometric Cumulative Distribution DIST E GEO InvG Inverse Geometric Cumulative Distribution calculates the minimum number of trials of a geometric cumulative probability distribution for specified values Calculation Result Out...

Страница 189: ...ulation accuracy affects calculation results If a warning message appears check the displayed values I Hypergeometric Distribution Hypergeometric Probability DIST E H GEO HPd Hypergeometric Probability calculates the probability at a specific single x value or each list element and the number of the trial on which the first success occurs for the hypergeometric distribution with a specified probab...

Страница 190: ... the xInv value only However when the xInv and xInv values are different the message will appear with both values The calculation results of Inverse Hypergeometric Cumulative Distribution are integers Accuracy may be reduced when the first argument has 10 or more digits Note that even a slight difference in calculation accuracy affects calculation results If a warning message appears check the dis...

Страница 191: ...e tail test where sample 1 is smaller than sample 2 Ʊ2 specifies one tail test where sample 1 is greater than sample 2 ƫ0 assumed population mean Ʊ population standard deviation Ʊ 0 Ʊ1 population standard deviation of sample 1 Ʊ1 0 Ʊ2 population standard deviation of sample 2 Ʊ2 0 List list whose contents you want to use as data List 1 to 26 List1 list whose contents you want to use as sample 1 da...

Страница 192: ...ion number of trials p Distribution success probability 0 p 1 I Output Terms z z score p p value t t score Ƶ2 Ƶ2 value F F value p estimated sample proportion p 1 estimated proportion of sample 1 p 2 estimated proportion of sample 2 M mean of sample M1 mean of sample 1 M2 mean of sample 2 sx sample standard deviation sx1 standard deviation of sample 1 sx2 standard deviation of sample 2 sp pooled s...

Страница 193: ... 1 1 C 2 n2 1 LinearReg t Test t r n 2 1 r2 b xi o yi p xi o 2 a p bo i 1 n i 1 n C2 GOF Test Oi The i th element of the observed list Ei The i th element of the expected list C2 two way Test Oij The element at row i column j of the observed matrix Eij The element at row i column j of the expected matrix 2 Sample F Test F sx1 2 sx2 2 ANOVA Test F MS MSe SS ni oi o 2 MS SS Fdf MSe SSe Edf i 1 k Fdf...

Страница 194: ...x2 2 n1 n2 2 α 2 Sample t Interval not pooled Left Right o1 o2 tdf 2 sx1 2 n1 sx2 2 n2 df 1 C2 n1 1 1 C 2 n2 1 α C sx1 2 n1 sx1 2 n1 sx2 2 n2 A level of significance A 1 C Level C Level confidence level 0 C Level 1 Z A 2 upper A 2 point of standard normal distribution tdf A 2 upper A 2 point of t distribution with df degrees of freedom I Distribution Continuous Distribution Probability Density Cum...

Страница 195: ...on Distribution x 0 1 2 p x x e μ μ x M mean M 0 Geometric Distribution p x p 1 p x 1 x 1 2 3 Hypergeometric Distribution p x MCx N MCn x NCn n Number of elements extracted from population 0 x integer M Number of elements contained in attribute A 0 M integer N Number of population elements n N M N integer Distribution Cumulative Distribution Inverse Cumulative Distribution Binomial Distribution p ...

Страница 196: ...PR depreciation calculations BOND bond calculations I Setup Items S Payment BGN END Specifies beginning of the period end of the period payment S Date Mode 365 360 Specifies calculation according to a 365 day 360 day year S Periods YR payment interval specification Annu Semi annual semiannual Note the following points regarding Setup screen settings whenever using the TVM mode The following graph ...

Страница 197: ...ses when viewing TVM mode calculation results Note that calculation results produced in this mode should be regarded as reference values only Whenever performing an actual financial transaction be sure to check any calculation results obtained using this calculator with against the figures calculated by your financial institution 2 Simple Interest This calculator uses the following formulas to cal...

Страница 198: ...he graph Each press of C while trace is turned on cycles the displayed value in the sequence present value PV m simple interest SI m simple future value SFV Pressing B cycles in the reverse direction Press to return to the parameter input screen 3 Compound Interest This calculator uses the following standard formulas to calculate compound interest S PV PMT FV n I x 0 PMT PV FV FV PV PMT n log 1 iS...

Страница 199: ...h installment payment in case of loan deposit in case of savings FV future value unpaid balance in case of loan principal plus interest in case of savings P Y installment periods per year C Y compounding periods per year Important Inputting Values A period n is expressed as a positive value Either the present value PV or future value FV is positive while the other PV or FV is negative Precision Th...

Страница 200: ... After drawing a graph you can press TRCE to turn on trace and read calculation results along the graph Press to return to the parameter input screen 4 Cash Flow Investment Appraisal This calculator uses the discounted cash flow DCF method to perform investment appraisal by totalling cash flow for a fixed period This calculator can perform the following four types of investment appraisal Net prese...

Страница 201: ... to display the following input screen for Cash Flow CASH I interest rate Csh list for cash flow If you have not yet input data into a list press LIST and input data into a list After configuring the parameters use one of the function menus noted below to perform the corresponding calculation NPV net present value IRR internal rate of return PBP payback period NFV net future value LIST inputs data...

Страница 202: ...st portion of a monthly installment the remaining principal and amount of principal and interest repaid up to any point S Formula a interest portion of installment PM1 17 b principal portion of installment PM1 PRN c balance of principal after installment PM2 BAL d total principal from installment PM1 to payment of installment PM2 3PRN e total interest from installment PM1 to payment of installment...

Страница 203: ...nts 1 through n PM2 second installment of installments 1 through n n installments I interest rate PV principal 307 payment for each installment FV balance following final installment P Y installments per year C Y compoundings per year After configuring the parameters use one of the function menus noted below to perform the corresponding calculation BAL balance of principal after installment PM2 IN...

Страница 204: ...ults along the graph The first press of TRCE displays 17 and PRN when n 1 Each press of C shows 17 and PRN when n 2 n 3 and so on Press to return to the parameter input screen 6 Interest Rate Conversion The procedures in this section describe how to convert between the annual percentage rate and effective interest rate S Formula APR annual percentage rate EFF effective interest rate n number of co...

Страница 205: ...nput screen 7 Cost Selling Price Margin Cost selling price or margin can be calculated by inputting the other two values S Formula 67 cost SEL selling price 05 margin Press COST from the Financial 2 screen to display the following input screen E COST Cst cost Sel selling price Mrg margin After configuring the parameters use one of the function menus noted below to perform the corresponding calcula...

Страница 206: ... d1 plus a number of days d1 D d1 D d1 minus a number of days d1 D An error Ma ERROR occurs if parameters are not configured correctly Use the following function menu to maneuver between calculation result screens REPT parameter input screen The Setup screen can be used to specify either a 365 day or 360 day year for financial calculations Day date calculations are also performed in accordance wit...

Страница 207: ...remaining depreciable value at the end of jth year I depreciation ratio S Sum of the Years Digits Method SYD SYDj depreciation charge for the jth year RDVj remaining depreciable value at the end of jth year Y 1 PV FV SL1 n 12 S PV FV SLj n 12 Y 1 Y 1 x12 PV FV n 12 S SLn 1 Y 1 PV FV SL1 n 12 S PV FV SLj n 12 Y 1 Y 1 x12 PV FV n 12 S SLn 1 100 I FPj RDVj 1 9 s 100 Y 1 I FP1 PV s 12 s FPn 1 RDVn Y 1...

Страница 208: ...preciation After configuring the parameters use one of the function menus noted below to perform the corresponding calculation SL Calculate depreciation for year j using the straight line method FP FP Calculate depreciation for year j using the fixed percentage method I Calculate depreciation ratio SYD Calculate depreciation for year j using the sum of the years digits method DB Calculate deprecia...

Страница 209: ...n date d2 Purchase date d1 Coupon Payment dates A B PRC price per 100 of face value CPN annual coupon rate YLD yield to maturity A accrued days 0 number of coupon payments per year 1 annual 2 semi annual N number of coupon payments between settlement date and maturity date RDB redemption price or call price per 100 of face value D number of days in coupon period where settlement occurs B number of...

Страница 210: ...ed below to perform the corresponding calculation PRC Calculate the bond s price PRC accrued interest INT and cost of bond CST YLD Calculate the yield to maturity Calculation Result Output Examples PRC PRC GRPH PRC MEMO An error Ma ERROR occurs if parameters are not configured correctly Use the following function menu to maneuver between calculation result screens REPT parameter input screen GRPH ...

Страница 211: ...Important The following operations cannot be performed on the fx 7400Gɉ You can use special functions in the RUN MAT mode or PRGM mode to perform calculations that are the same as the TVM mode financial calculations Example To calculate the total interest and principal paid for a 2 year 730 day 300 loan at a simple annual interest rate of 5 Use a Date Mode setting of 365 1 From the Main Menu enter...

Страница 212: ...ram A file name can be up to eight characters long The following are the characters you can use in a file name A through Z r Q spaces 0 through 9 Registering a file name uses 32 bytes of memory Example To calculate the surface area cm2 and volume cm3 of three regular octahedrons when the length of one side is 7 10 and 15 cm respectively Store the calculation formula under the file name OCTA The fo...

Страница 213: ...BASE general calculation number base program input 0 password registration SYBL symbol menu S When you are inputting a program RUN default TOP BTM top bottom of program SRC search MENU mode menu STAT MAT LIST GRPH DYNA TABL RECR statistic matrix list graph Dynamic Graph Table recursion menu Aja toggles between upper case and lower case input CHAR displays a screen for selecting various mathematica...

Страница 214: ...ISP conversion of displayed value to decimal hexadecimal binary octal Aja SYBL Pressing PRGM displays the following PRGM PROGRAM menu Prog program recall JUMP REL conditional jump relational operator menu multi statement command Pressing K SET UP displays the mode command menu shown below Dec Hex Bin Oct 1 Programs input after pressing BASE are indicated by B to the right of the file name EXE EDIT...

Страница 215: ...on Note that pressing does not display the location of the error if the program is password protected S To eliminate bugs that cause bad results If your program produces results that are not what you normally expect check the contents of the program and make necessary changes TOP Moves the cursor to the top of the program BTM Moves the cursor to the bottom of the program I Searching for Data Insid...

Страница 216: ...ching for a File S To find a file using initial character search Example To use initial character search to recall the program named OCTA 1 While the program list is on the display press E SRC and input the initial characters of the file you want to find E SRC H O C T 2 Press U to search The name that starts with the characters you input highlights If there is no program whose file name starts wit...

Страница 217: ...rotect it with a password that limits access to the program contents to those who know the password You do not need to input the password to run a program The password input procedure is identical to that used for file name input 1 While the program list is on the display press NEW and input the file name of the new program file 2 Press 0 and then input the password 3 Press U to register the file ...

Страница 218: ...0 StrSrc 8 20 StrUpr 8 20 While WhileEnd 8 10 Input Command 8 8 Output Command 8 8 Multi statement Command 8 8 Carriage Return 8 8 Comment Text Delimiter 8 8 2 Jump Code 8 13 x r b Relational Operators 8 18 8 20 The following are conventions that are used in this section when describing the various commands Boldface Text Actual commands and other items that always must be input are shown in boldfa...

Страница 219: ...splays alpha character text or the result of the calculation immediately before the command The output command should be used at locations where you would normally press the U key during a manual calculation Multi statement Command Function Connects two statements for sequential execution without stopping Description Unlike the output command statements connected with the multi statement command a...

Страница 220: ...continues with the statement following IfEnd For To Step Next Function This command repeats everything between the For statement and the Next statement The starting value is assigned to the control variable with the first execution and the value of the control variable is changed according to the step value with each execution Execution continues until the value of the control variable exceeds the...

Страница 221: ...ts condition is true non zero Syntax While condition _ statement _ WhileEnd numeric expression Parameters expression Description This command repeats the commands contained in the loop as long as its condition is true non zero When the condition becomes false 0 execution proceeds from the statement following the WhileEnd statement Since the condition comes after the While statement the condition i...

Страница 222: ...ollowing the Prog command A Goto Lbl command inside of a subroutine is valid inside of that subroutine only It cannot be used to jump to a label outside of the subroutine If a subroutine with the file name specified by the Prog command does not exist an error occurs In the RUN MAT or RUN mode inputting the Prog command and pressing U launches the program specified by the command Return Function Th...

Страница 223: ...Lbl label name Parameters label name value 0 to 9 variable A to Z r Q Description This command consists of two parts Goto n where n is a parameter as described above and Lbl n where n is the parameter referenced by Goto n This command causes program execution to jump to the Lbl statement whose n parameter matches that specified by the Goto statement This command can be used to loop back to the beg...

Страница 224: ...the comparison If the comparison returns a true result execution continues with the statement following the command If the comparison returns a false result execution jumps to the statements following the multi statement command display command or carriage return Menu Function Creates a branching menu in a program Syntax Menu string menu name string branch name 1 value or variable 1 string branch ...

Страница 225: ...ed by matrix name All matrix data is deleted if nothing is specified for matrix name ClrText Function This command clears the text screen Syntax ClrText Description This command clears text from the screen during program execution I Display Commands DISP DispF Tbl DispR Tbl Not included on the fx 7400GII No parameters Function These commands display numeric tables Description These commands genera...

Страница 226: ...uces a plot type graph DrawR3 Con DrawR3 Plt Not included on the fx 7400GII No parameters Function These commands graph recursion expressions with 3an 3bn or 3cn as the vertical axis and n as the horizontal axis Description These commands graph recursion expressions in accordance with conditions defined within the program with 3an 3bn or 3cn as the vertical axis and n as the horizontal axis DrawR3...

Страница 227: ...ple PlotPhase 3bn 1 3an 1 Graphs a phase plot using 3bn 1 for the x axis and 3an 1 for the y axis I Input Output Commands I O Getkey Function This command returns the code that corresponds to the last key pressed Syntax Getkey Description This command returns the code that corresponds to the last key pressed A value of zero is returned if no key was pressed previous to executing this command This ...

Страница 228: ...ile the column is designated by a value from 1 to 21 Example Cls Locate 7 1 CASIO FX This program displays the text CASIO FX in the center of the screen In some cases the ClrText command should be executed before running the above program Receive Send Function This command receives data from and sends data to a connected device Syntax Receive data Send data Description This command receives data f...

Страница 229: ...rs enclosed in double quotes In a program strings are used to specify display text A string made up of numbers like 123 or an expression like x 1 cannot be processed as a calculation To display a string at a specific location on the screen use the Locate command page 8 17 To include double quotes or a backslash in a string put a backslash in front of the double quotes or backslash Example 1 To inc...

Страница 230: ...ng 2 Description Compares two strings and returns one of the following values Returns 0 when string 1 string 2 Returns 1 when string 1 string 2 Returns 1 when string 1 string 2 Strlnv Function Inverts the sequence of a string Syntax StrInv string StrJoin Function Joins string 1 and string 2 Syntax StrJoin string 1 string 2 Note The same result also can be achieved using the command page 8 20 StrLe...

Страница 231: ...ring left or right n characters Syntax StrShift string n 9999 n 9999 n is an integer Description Shift is to the left when n is positive and to the right when n is negative Omitting n uses a default value of 1 Example StrShift abcde 2 Returns the string cde StrSrc Function Searches string 1 starting from the specified point nth character from beginning of string to determine if it contains the dat...

Страница 232: ...etween the text and calculation Inputting more than 21 characters causes the text to move down to the next line The screen scrolls automatically if the text exceeds 21 characters You can specify up to 255 bytes of text for a comment I Using Matrix Row Operations in a Program Not available on the fx 7400GII These commands let you manipulate the rows of a matrix in a program For this program enter t...

Страница 233: ... syntax to use for this program Row 4 A 2 3 Rows to be added Row for which scalar multiplication is to be calculated Matrix name Multiplier Mat A S To add two rows Row Example 4 To add Row 2 to Row 3 of the matrix in Example 1 The following is the syntax to use for this program Row A 2 3 Row number to be added to Row number to be added Matrix name Mat A I Using Graph Functions in a Program You can...

Страница 234: ...number PxlOff line number column number PxlChg line number column number PxlTest line number column number Text line number column number text Text line number column number expression SketchThick Sketch or Graph statement SketchBroken Sketch or Graph statement SketchDot Sketch or Graph statement SketchNormal Sketch or Graph statement Tangent function X coordinate Normal function X coordinate Inve...

Страница 235: ...s in a program lets you generate numeric tables and perform graphing operations The following shows various types of syntax you need to use when programming with Recursion Table Graph functions Recursion formula input an 1 Type Specifies recursion type 3an 2 m an 1 4bn 6 m bn 1 Table range setting Numeric table generation 1 m R Start DispR Tbl 5 m R End Graph draw operation 1 m a0 Connect type Dra...

Страница 236: ...data list name Bar graph orientation Length or Horizontal The graph conditions that are required depends on the graph type See Changing Graph Parameters page 6 1 The following is a typical graph condition specification for a scatter diagram or xyLine graph S Gph1 DrawOn Scatter List 1 List 2 1 Square In the case of an xy line graph replace Scatter in the above specification with xyLine The followi...

Страница 237: ...st 1 List 2 The following is a typical graph condition specification for a pie graph S Gph1 DrawOn Pie List 1 None The following is a typical graph condition specification for a bar graph S Gph1 DrawOn Bar List 1 None None StickLength To draw a statistical graph insert the DrawStat command following the graph condition specification line ClrGraph S Wind Auto 1 2 3 m List 1 1 2 3 m List 2 S Gph1 Dr...

Страница 238: ...Lower and Upper input values are assigned respectively to variables p tLow and tUp and p is assigned to Ans To draw a Ƶ2 cumulative distribution graph DrawDistChi Lower Upper df Degree of freedom Data upper limit Data lower limit Executing DrawDistChi performs the above calculation in accordance with the specified conditions and draws the graph At this time the Lower x Upper region on the graph is...

Страница 239: ...egression statistical calculation LinearReg ax b List 1 List 2 List 3 Frequency data Frequency y axis data YList x axis data XList Any one of the following can be specified as the calculation type LinearReg ax b linear regression ax b type LinearReg a bx linear regression a bx type Med MedLine Med Med calculation QuadReg quadratic regression CubicReg cubic regression QuartReg quartic regression Lo...

Страница 240: ...ormal cumulative distribution p value for the specified data Syntax NormCD Lower Upper S ƫ Single values or lists can be specified for Lower and Upper Calculation results p ZLow and ZUp are assigned respectively to variables p ZLow and ZUp Calculation result p also is assigned to Ans ListAns when Lower and Upper are lists InvNormCD Returns the inverse normal cumulative distribution lower and or up...

Страница 241: ...hiPD x df A single value or a list can be specified for x Calculation result p is assigned to variables p and Ans ListAns when x is a list ChiCD Returns the Ƶ2 cumulative distribution p value for the specified data Syntax ChiCD Lower Upper df Single values or lists can be specified for Lower and Upper Calculation result p is assigned to variables p and Ans ListAns when Lower and Upper are lists In...

Страница 242: ...an be specified for p The calculation result X value is assigned to the xInv and Ans variables ListAns when p is a list Poisson Distribution PoissonPD Returns the Poisson probability p value for the specified data Syntax PoissonPD x ƫ A single value or a list can be specified for x Calculation result p is assigned to variables p and Ans ListAns when x is a list PoissonCD Returns the Poisson cumula...

Страница 243: ... each X Calculation result p is assigned to variables p and Ans ListAns when X is a list InvHypergeoCD Returns the inverse hypergeometric cumulative distribution for the specified data Syntax InvHypergeoCD p n M N A single value or a list can be specified for p The calculation result X value is assigned to the xInv and Ans variables ListAns when p is a list I Using the TEST Command to Execute a Co...

Страница 244: ...istAns elements 1 through 7 t Test OneSampleTTest Executes 1 sample t test calculation Syntax OneSampleTTest ƫcondition ƫ0 M sx n OneSampleTTest ƫcondition ƫ0 List Freq Output Values t p M sx n are assigned respectively to the variables with the same names and to ListAns elements 1 through 5 TwoSampleTTest Executes 2 sample t test calculation Syntax TwoSampleTTest ƫ1 condition M1 sx1 n1 M2 sx2 n2 ...

Страница 245: ... M1 M2 sx1 sx2 n1 n2 are assigned respectively to the variables with the same names and to ListAns elements 1 through 8 ANOVA OneWayANOVA Executes one factor ANOVA analysis of variance Syntax OneWayANOVA List1 List2 List1 is Factor list A and List2 is the Dependent list Output Values Adf Ass Ams AF Ap ERRdf ERRss ERRms are assigned respectively to variables Adf SSa MSa Fa pa Edf SSe MSe Also outpu...

Страница 246: ... omitted for all compound interest calculations When they are omitted calculations are performed using P Y 12 and C Y 12 If you perform a calculation that uses a compound interest function Cmpd_n Cmpd_I Cmpd_PV Cmpd_PMT Cmpd_FV the argument s you input and the calculation results will be saved to the applicable variables n I PV etc If you perform a calculation that uses any other type of financial...

Страница 247: ...paid for payment PM1 Syntax Amt_PRN PM1 PM2 I PV PMT P Y C Y Amt_3INT Returns the total principal and interest paid from payment PM1 to PM2 Syntax Amt_3INT PM1 PM2 I PV PMT P Y C Y Amt_3PRN Returns the total principal paid from payment PM1 to PM2 Syntax Amt_3PRN PM1 PM2 I PV PMT P Y C Y Interest Rate Conversion Cnvt_EFF Returns the interest rate converted from the nominal interest rate to the effe...

Страница 248: ...e Pie List List_ TYPE 2 DIST DrwN DrawDistNorm_ Drwt DrawDistT_ DrwC DrawDistChi_ DrwF DrawDistF_ CALC 1VAR 1 Variable_ 2VAR 2 Variable_ 3 Med Med MedLine_ X 2 QuadReg_ X 3 CubicReg_ X 4 QuartReg_ Log LogReg_ 4 Pwr PowerReg_ Sin SinReg_ Lgst LogisticReg_ MAT Swap Swap_ Rw Row_ Rw Row _ Rw Row _ LIST Srt A SortA Srt D SortD GRPH SEL On G_SelOn_ Off G_SelOff_ TYPE Y Y Type r r Type Parm ParamType X ...

Страница 249: ... mile mile VLUM cm cm mL mL L L m m in in ft ft fl_oz UK fl_oz UK fl_oz US fl_oz US gal US gal US gal UK gal UK pt pt qt qt tsp tsp tbsp tbsp cup cup TIME ns ns μs μs ms ms s s min min h h day day week week yr yr s yr s yr t yr t yr TMPR oC oC K K oF oF oR oR VELO m s m s km h km h knot knot ft s ft s mile h mile h MASS u u mg mg g g kg kg mton mton oz oz lb lb slug slug ton short ton short ton lo...

Страница 250: ... RightXmin max RightXmax scal RightXscl dot RightXdot R Y min RightYmin max RightYmax scal RightYscl R T Q min RightTQmin max RightTQmax ptch RightTQptch FACT Xfct Xfct Yfct Yfct STAT X n n x x 3x 3x 3x 2 3x2 Sx Sx sx sx minX minX maxX maxX Y y y 3y 3y 3y 2 3y2 3xy 3xy Sy Sy sy sy minY minY maxY maxY GRPH a a b b c c d d e e r r r2 r2 MSe MSe Q1 Q1 Med Med Q3 Q3 Mod Mod Strt H_Start Pitch H_pitch ...

Страница 251: ...Sci Sci_ Norm Norm_ Eng On EngOn Off EngOff Eng Eng S L S L Normal S L Thick S L Broken S L Dot DRAW Con G Connect Plot G Plot DERV On DerivOn Off DerivOff BACK None BG None Pict BG Pict_ FUNC On FuncOn Off FuncOff SIML On SimulOn Off SimulOff S WIN Auto S WindAuto Man S WindMan LIST File File_ LOCS On LocusOn Off LocusOff T VAR Rang VarRange List VarList_ 3DSP On 3dispOn Off 3dispOff RESID None R...

Страница 252: ...CD InvN InvNormCD t TPd tPD TCd tCD Invt InvTCD CHI CPd ChiPD CCd ChiCD InvC InvChiCD F FPd FPD FCd FCD InvF InvFCD BINM BPd BinomialPD BCd BinomialCD InvB InvBinomialCD POISN PPd PoissonPD PCd PoissonCD InvP InvPoissonCD GEO GPd GeoPD GCd GeoCD InvG InvGeoCD H GEO HPd HypergeoPD HCd HypergeoCD InvH InvHyperGeoCD 6 Z 1 S OneSampleZTest_ 2 S TwoSampleZTest_ 1 P OnePropZTest_ 2 P TwoPropZTest_ t 1 S...

Страница 253: ...gram continually divides a natural number by factors until all its prime factors are produced Purpose This program accepts input of natural number A and divides it by B 2 3 5 7 to find the prime factors of A If a division operation does not produce a remainder the result of the operation is assigned to A The above procedure is repeated until B A Example 462 2 s 3 s 7 s 11 CEAU U UU U ...

Страница 254: ...the pitch step size of X Y1 Coordinate values of upper half of ellipse Y2 Coordinate values of lower half of ellipse Y3 Distances between right focus and loci Y4 Distances between left focus and loci Y5 Sum of Y3 and Y4 Next the program plots the foci and values in Y1 and Y2 Purpose This program shows that the sums of the distances between the loci and two foci of an ellipse are equal BU U U U ...

Страница 255: ... cell where the cell cursor is currently located When multiple cells are selected the edit box indicates the selected cell range Function menu You can enter the following types of data into a cell Constants A constant is something whose value is fixed as soon as you finalize its input A constant can be either a numeric value or a calculation formula such as 7 3 sin30 A1s2 etc that does not have an...

Страница 256: ... command Inputs the cell range specification command If Inputs the CellIf command CEL Displays a submenu for inputting the following commands CellMin CellMax CellMean CellMedian CellSum CellProd REL Displays a submenu for inputting the following relational operators x P O 2 Basic Spreadsheet Operations This section explains spreadsheet file operations how to move the cursor and select one or more ...

Страница 257: ... delete the file or No to cancel without deleting anything 4 To return to the spreadsheet from the file list press Deleting the currently open file will automatically create a new file named SHEET and display its spreadsheet I Recalculating All of the Formulas in the Currently Open Spreadsheet The S SHT mode has an Auto Calc features that automatically recalculates all of the formulas in a spreads...

Страница 258: ...ll A range of cells See To select a range of cells page 9 5 An entire row of cells Move the cell cursor to column A of the row whose cells you want to select and then press B Pressing B while the cell cursor is located at cell A2 for example will select the entire second row from A2 to Z2 This will cause A2 Z2 which indicates the selected range to appear in the edit box An entire column of cells M...

Страница 259: ...move the cell cursor to the end point of the range of cells you want to select The edit box will show the range of the selected cells To cancel cell selection press If you do the cell cursor will be located at the end point of the range you selected I Data Constants Text Formula Input Basics First let s have a look at a few basic procedures that apply regardless of the type of data you are inputti...

Страница 260: ...29 I Inputting a Constant Value Calculation Result Number Sequence into a Cell A constant is something whose value is fixed as soon as you finalize its input A constant can be either a numeric value or a calculation formula such as 7 3 sin30 A1s2 etc that does not have an equal sign in front of it Inputting QB U for example will cause the value 0 5 the calculation result to appear in the cell when...

Страница 261: ...cell is different from the one you specified in step 1 of this procedure Example J B U B1 Each time you press U after inputting data for a setting item the highlighting will move to the next setting item You also can use D and A to move the highlighting upwards and downwards as required Performing the next step will input the number string automatically starting from the specified cell If any cell...

Страница 262: ... 78 20 1560 Procedure 1 Input the text for line 1 and the applicable values in cells A2 through B4 2 Move the cursor to cell C2 and input the formula for A2 s B2 T A A J B AU 3 Copy the formula in cell C2 and copy it into cells C3 and C4 Move the cell cursor to cell C2 and then perform the following operation EDIT COPY A PASTE A PASTE For details about the copy and paste operations see Copying and...

Страница 263: ...le copying at pasting in cell C3 will result in B3 5 in cell C3 Moving from column A to column B one column causes A to change to B while moving from row 1 to row 3 changes two rows changes the 1 to 3 Important If the result of a copy and paste operation causes a relative cell reference name to change to something that is outside the range of the spreadsheet cells the applicable column letter and ...

Страница 264: ...e range If the location you select is within the range that you copied performing step below will cause the exiting data to be overwritten with the pasted data 4 Press PASTE This will paste the copied data To paste the same data in other locations repeat steps 3 and 4 5 After you are finish pasting the data press to exit paste standby I Cutting and Pasting Cell Contents You can use cut and paste t...

Страница 265: ...ow will cause the exiting data to be overwritten with the pasted data 4 Press PASTE This will paste the data from the cell s you selected in step 1 and paste it into the location you selected in step 3 Regardless of whether Auto Calc is enabled or disabled page 9 3 pasting cut data will cause all of the formulas in the spreadsheet to be recalculated I Inputting the Same Formula into a Range of Cel...

Страница 266: ...the range of cells you specified I Sorting Constant Data Note that only constant data can be sorted You can select multiple columns within a single line or multiple lines within a single column for sorting S To sort constant data 1 Select a range of column cells in a single row or a range of row cells in a single column See To select a range of cells page 9 5 A Syntax ERROR message will appear if ...

Страница 267: ...ions to specify the location of the insert and the number of rows or columns to be inserted To insert rows Starting with the row immediately below of the row where you want the insert to be performed select the same number of rows that you want to insert Example To insert three rows above row 2 you could select A2 A4 B2 C4 etc To insert columns Starting with the column immediately to the right of ...

Страница 268: ...minimum value in a specified range of cells Input Key Operation CEL Min Syntax CellMin start cell end cell Example CellMin A3 C5 Returns the minimum value of the data in cell range A3 C5 CellMax Cell Maximum Value Returns the maximum value in a specified range of cells Input Key Operation CEL Max Syntax CellMax start cell end cell Example CellMax A3 C5 Returns the maximum value of the data in cell...

Страница 269: ...B mode and moves the cursor to A1 G CLIP CAAAA Specifies the selection range for the CLIP function U 2 Press U to finalize input of the formula 4 Drawing Statistical Graphs and Performing Statistical and Regression Calculations When you want to check the correlation between two sets of data such as temperature and the price of some product trends become easier to spot if you draw a graph that uses...

Страница 270: ...n change the configuration of graph settings on the screen that appears when you press SET on the GRPH menu For details see General Graph Settings Screen Operations below I General Graph Settings Screen Operations You can use the general graph setting screen to specify the range of data to be used for graphing and to select the type of graph to be drawn S To configure statistical graph settings 1 ...

Страница 271: ...values indicating the frequency of each graph data item Select 1 if you do not want to use frequency values Mark Type Specify the type of mark U s or to use as the mark on the scatter plot 3 Use D and A to move the highlighting to the setting item you want to change On the function menu that appears select the setting you want For details about the StatGraph1 Graph Type and Mark Type settings see ...

Страница 272: ...Drawn Paired Variable Graph on page 6 14 3 To return to the spreadsheet screen press I Using the Statistical Calculation Data Range Specification Screen You can use a special setting screen to specify the range of data to be used for statistical calculation S To specify the data range for statistical calculation 1 Input the statistical calculation data into the spreadsheet and then select its rang...

Страница 273: ... Mode and S SHT Mode Function Menu Correspondence Table In both the STAT mode and the S SHT mode statistical graph functions are on the GRPH function menu and statistical regression calculation functions are on the CALC function menu The structures of these menus and their submenus are the same in the STAT mode and the S SHT mode For details about each menu item refer to the pages referenced in th...

Страница 274: ...en specify the file number on the screen that appears The first column of the selected range is stored in the specified file as List 1 the second column is saved as List 2 and so on Matrix Memory Mat A Mat Z You can store data in a range of cells that spans a multiple rows and columns in matrix memory While a range of cells is selected press E STO MAT and then specify the matrix name on the screen...

Страница 275: ...Move setting page 1 29 File Memory File 1 File 6 You can recall data from a specified file memory to the spreadsheet Select the cell you want to be the upper left corner of the recalled data and then press E RCL FILE Next specify the file memory number on the screen that appears Matrix Memory Mat A Mat Z You can recall data from a specified matrix memory to the spreadsheet Select the cell you want...

Страница 276: ...dents Students can use eActivity files to keep classroom notes memos of problems and their solutions etc Important The fx 7400GII and fx 9750GII are not equipped with the e ACT mode 1 eActivity Overview The first thing that appears when you select the e ACT mode on the Main Menu is the file menu No e ACT mode files in memory At least one e ACT mode file in Opening a file in the eActivity mode will...

Страница 277: ...iles models that support SD cards only This menu item shows SD while the file menu is showing main memory files and SMEM while the file menu is showing SD card files Only the NEW function key is are displayed when there are no eActivity files in memory At least 128 kbytes of memory area is required when the e ACT mode is used for the first time A Memory Full error will appear if there is not enoug...

Страница 278: ...s MATH under Menu when a Text Line is Selected Menu when a Strip is Selected FILE Displays the following file operation submenu SAVE SV AS OPT CAPA Same as the FILE submenus under Workspace Screen Common Menu Items SIZE Displays the size of the strip at the current cursor position CHAR Same as CHAR under Menu when a Text Line is Selected A a Same as A a under Menu when a Text Line is Selected 3 eA...

Страница 279: ... IT will count names like ITXX ITABC IT123 as hits but not names like XXIT or ABITC 3 Press U If a name matches the text you input in step 2 it will be selected on the file menu The message Not Found will appear if a match cannot be found Press the key to close the message dialog box 4 Inputting and Editing Data All of the operations in this section are performed on the eActivity workspace screen ...

Страница 280: ...e Text in the text line wraps automatically to fit inside the display area Word Wrap Function Note however that numeric expressions and commands do not wrap 1 Scroll arrows will appear on the left and right sides of the calculation line to let you know some of the calculation does not fit within the calculation line display area In this case you can use the left and right cursor keys to scroll the...

Страница 281: ... formula into an eActivity 1 Move the cursor to a calculation line While the cursor is in a calculation line CALC will be displayed for the F3 function menu item This indicates that calculation expression input is enabled Math line cursor This will cause the key menu to change to CALC TEXT will be displayed for the F3 function menu item if the cursor is located in a text line Pressing CALC will ch...

Страница 282: ...Activity mode List Editor function menu provides only screen two of the STAT mode List Editor function menu To return to the workspace screen from the List Editor in the eActivity mode press In the eActivity mode values for list variables are saved separately for each file List variable values will be different from those produced when called from a non eActivity mode I Inserting a Calculation Sto...

Страница 283: ... on page 10 10 for more information Notes RUN MAT mode Matrix Editor data Matrix Editor EQUA mode simultaneous equation solution screen data Simul Equation EQUA mode high order equation solution screen data Poly Equation DYNA mode graph screen data Dynamic Graph TVM mode calculation solution screen data Financial S SHT mode spreadsheet screen data SpreadSheet E CON2 mode setup wizard data Econ Set...

Страница 284: ...nd then press U 6 Press U again to start creating strip data This will start up the built in application for the selected strip type GRAPH mode in this example and display the graph screen At this point a blank graph screen appears because there is no data yet 7 Press to display the graph function list screen 8 Enter the function you want to graph Example Y 2 1 X2 1 9 Press DRAW This will graph th...

Страница 285: ...by pressing the key S To change the title of a strip 1 Use A and D to select the strip whose title you want to change 2 Input up to 16 characters for the strip title and then press U The remainder of the existing title will disappear as soon as you input the first character Input the new title in its entirety If you want to partially edit the existing title press B or C first to move the cursor Pr...

Страница 286: ...it on the workspace screen An eActivity file for OS Version 2 00 or later may have a file name extension of g2e Performing either of the following operations on a calculator model covered by this manual with OS Version 2 00 or later operating system to save an eActivity file always will cause the extension g2e to be appended to the file name Saving a newly created file Saving an existing file usin...

Страница 287: ...d then saving the file may cause the new save to retain the g1e file name extension Though you will be able to open such a file on a calculator running an operating system older than OS Version 2 00 since it has the g1e file name extension you will not be able to use the math functions and commands added since OS Version 2 00 I Displaying the eActivity Memory Usage Screen The maximum size of an eA...

Страница 288: ...nce a guide records only key operations that are contained within a strip operations performed after exiting the strip to go to another strip to go to another file cannot be recorded Running a Guide Running a guide that you created will sequentially display key operations and comments The student can become familiar with calculator operations simply by performing input as instructed Three Types of...

Страница 289: ...here are no key operations recorded If you press GUIDE while a strip you selected already contains data a confirmation will appear asking whether you want to delete the existing operation data Yes Deletes the strip s existing operation data and starts guide creation from an empty strip No Cancels guide creation and returns to the eActivity workspace screen S To create an n key operation 1 On the o...

Страница 290: ...box 6 After inputting comment text press U to register the n key operation input This will return to the operation pattern selection screen You can now edit the guide by pressing PLAY and selecting the key operation you want to change See Editing a Guide page 10 18 for details about editing guides S To create a 1 key operation The following operation assumes that you are continuing from the proced...

Страница 291: ...ing the guide performs auto key input at low speed Use this option for operations that the teacher explains while they are being performed and for trace operations performed G Solve analysis Executing the guide performs auto key input at medium speed Use this option for simple value input expression input and function menu operations Executing the guide performs auto key input at high speed Use th...

Страница 292: ...ortant part of the screen becomes blocked by the comment box BTM displays the comment box at the bottom of the screen TOP displays the comment box at the top of the screen HIDE hides the comment box BTM TOP HIDE S To exit the guide creation mode 1 While creating a guide press END This will display the dialog box shown to the right Yes Turns on the exit strip setting When using the guide as a demo ...

Страница 293: ...o edit a guide Editing of the guide you are currently creating Editing of the guide of an existing strip from the eActivity workspace screen I Editing the Guide You Are Creating S To display the key editing screen In this example we show how to display the key editing screen of a graph function Y1 X2 1 that is input at the end of the operation under To create an n key operation page 10 14 1 On the...

Страница 294: ...lays the next key Use D and A to change the key indicator display position D Displays the key indicator in the upper right corner A Displays the key indicator in the lower right corner 4 Press EDIT This will display the key editing screen INS inserts one key before the current key OVW overwrites the current key NOTE edits the current comment AUTO inserts an AUTO operation after the current key See...

Страница 295: ...o change 2X2 1 to 2X2 2 by overwriting the key with the A key 1 This will display the key editing screen 2 Press OVW 3 Press A This will overwrite the key with the A key and display the guide creation screen from the next key U key S To edit an n key operation comment 1 This will display the key editing screen 2 Press NOTE ...

Страница 296: ...l delete the key and display the guide creation screen from the next key A key S To exit a editing operation 1 Press END 2 Press Yes or No Exits the editing operation and returns to the eActivity workspace screen S To edit the guide of an existing strip from the eActivity workspace screen 1 On the eActivity workspace screen select a strip that already has a guide and then press E to display page t...

Страница 297: ...he key indicator that appears in the upper or lower right corner of the screen This will cause the next key to be pressed to appear in the upper or lower right corner 3 Perform the key operation in accordance with the keys that appear on the screen Exit Strip ON U will appear in the upper or lower right corner when the guide is complete Exit Strip OFF The strip will be freely usable when the guide...

Страница 298: ... editing screen press PLAY S To insert SETUP or V Window setting changes into a key operation sequence On the editing screen display the location where you want to insert the setting change operation insert an n key operation and then input the change operation S To allow students to continue with their own operation after executing a problem guide Input an n key operation with the example and spe...

Страница 299: ...leted by batteries going dead or when you perform a full reset The storage memory uses flash memory so data is safe even when power is interrupted Normally you should use the storage memory for data you need to store securely for long periods loading data into the main memory only when you need it Use of SD card memory when an SD card is loaded in the SD card slot also is supported by the fx 9860G...

Страница 300: ...SD Use the cursor D and A keys to move the highlighting and check the number of bytes used by each type of data Line 7 shows how many bytes of memory are currently unused in the currently selected memory main storage or SD card The first time you store data to the storage memory the calculator will reserve a management memory area automatically which will reduce the Free value by 65536 bytes On th...

Страница 301: ...1 to 6 List file MATRIX 1 Matrix group MAT n n A to Z and Ans 1 Matrix PICTURE Picture memory group PICT n n 1 to 20 Picture memory PROGRAM Program group Each program name Programs RECURSION 1 Recursion data SETUP Setup data STAT Stat result data STRING String memory group STR n n 1 to 20 String memory SYSTEM OS and data shared by applications clipboard replay history etc S SHEET 2 Spreadsheet gro...

Страница 302: ...dicates there is no SD card loaded in the calculator I Creating a Folder in Storage Memory or on an SD Card S To create a new folder 1 While storage memory or SD card memory data is on the display press MK F to display the folder name input screen 2 Input up to eight characters for the name you want to give to the folder Only the following characters are supported A through Z 0 through 9 Inputting...

Страница 303: ...to select the currently highlighted item which is indicated by the black selection pointer C appearing next to it Pressing SEL again will deselect the item causing the selection pointer to disappear You can select multiple files if you want SEL Selecting a group or folder also selects everything inside of it Deselecting a group or folder deselects all of its contents If you select one or more indi...

Страница 304: ...er to which you want to copy the data This displays the file name input screen 5 Input the file name you want to give to the file To cancel the copy operation press 6 Press U This copies the data 7 The message Complete appears when the copy operation is complete Pressing will return to the MEMORY mode initial screen 1 Copying data from the storage memory or an SD card causes one of the screens sho...

Страница 305: ...data at the copy destination with the same name as the data being copied An overwrite confirmation message appears if there is data with the same name Yes overwrites the existing data with the new data No advances to the next data item without copying the data with the same name Pressing will cancel the copy operation and return to the MEMORY mode initial screen Overwrite check is performed for th...

Страница 306: ...iple files if you want 3 Press DEL Press Yes to delete the file Press No to cancel the delete operation S To delete SD card files fx 9860GII SD only 1 Display the SD card memory information screen See Memory Information Screen on page 11 2 2 Select the file s you want to delete You can select multiple files if you want 3 Press DEL Press Yes to delete the file Press No to cancel the delete operatio...

Страница 307: ...S appears highlighted on display S To search for a file in the SD card fx 9860GII SD only Example To search for all files in the SD card whose names begin with the letter R 1 Display the SD card memory information screen See Memory Information Screen on page 11 2 2 Press SRC Input the letter R for the keyword The first file name that begins with the letter R appears highlighted on display The mess...

Страница 308: ...g message appears if there is already backup data in the storage memory Press Yes to back up the data or No to cancel the backup operation A Memory Full occurs when there is not enough space available in the storage memory to complete the backup operation S To restore backup data to the main memory 1 On the initial MEMORY mode screen press BKUP On the screen that appears you can confirm whether or...

Страница 309: ...oad operations Fragmentation can cause blocks of memory to become unavailable for data storage Because of this you should periodically perform the storage memory or SD card optimization procedure which rearranges the data in the storage memory or SD card and makes memory usage more economical S To optimize the storage memory 1 On the initial MEMORY mode screen press OPT to optimize the storage mem...

Страница 310: ...r key makes display contrast darker The B cursor key makes display contrast lighter INIT returns display contrast to its initial default Press or QUIT to return to the initial SYSTEM mode screen You can adjust contrast while any screen is on the display by pressing and then C or B To exit contrast adjustment press again I Power Properties Settings S To specify the Auto Power Off trigger time While...

Страница 311: ...ht turned on until the backlight key is pressed or until the calculator is turned off 3 Press or QUIT to return to the initial SYSTEM mode screen I System Language Setting Use LANG to specify the display language for built in applications S To select the message language 1 From the initial SYSTEM mode screen press LANG to display the Message Language selection screen 2 Use the D and A cursor keys ...

Страница 312: ...ons Menu languages and versions User name 3 Press or QUIT to return to the initial SYSTEM mode screen The operating system version that actually appears depends on the calculator model S To register a user name 1 While the Version list is displayed press NAME to display the user name input screen 2 Input up to eight characters for the user name you want 3 After inputting the name press U to regist...

Страница 313: ... Setup Information Delete Main Memory Data Delete Add in Applications Delete Storage Memory Data Excluding Add in Applications Format SD Card STUP 5 MAIN 5 5 ADD 5 SMEM 5 A S 5 5 E M S 5 5 5 E ALL 5 5 5 5 E SD 5 2 Press the function key that corresponds to the reset operation you want to perform 3 In response to the confirmation message that appears press Yes to perform the reset operation you spe...

Страница 314: ...ng steps on both units to specify 3PIN as the cable type 1 From the Main Menu enter the LINK mode 2 Press CABL This displays the cable type selection screen 3 Press 3PIN Cable Models that are supported for this configuration are shown below fx 9860GII SD fx 9860GII fx 9860G AU PLUS fx 9750GII fx 7400GII fx 9860G Slim OS 2 00 1 11 fx 9860G SD OS 2 00 1 05 fx 9860G OS 2 00 1 05 fx 9860G AU OS 2 00 1...

Страница 315: ...eed BPS 9600 bps max Connected with CFX 9850G series or fx 7400G series calculator 115200 bps max Connected with another fx 9860GII SD fx 9860GII fx 9860G AU PLUS fx 9750GII fx 7400GII fx 9860G Slim OS 2 00 1 11 fx 9860G SD OS 2 00 1 05 fx 9860G OS 2 00 1 05 or fx 9860G AU OS 2 00 1 05 calculator Parity PARITY NONE USB port Communication speed is in accordance with USB standards The fx 7400GII is ...

Страница 316: ...ve Actual data receive starts as soon as data is sent from the sending unit Sending unit To set up the calculator to send data press TRAN while the data communication main menu is displayed This displays a screen for specifying the data selection method SEL selects new data CRNT automatically selects previously selected data 1 1 The previously selected data memory is cleared whenever you change to...

Страница 317: ...like after the data communication operation is complete Sending Unit Receiving Unit Press to return to the data communication main menu I Configuring the Receiver s Wakeup Feature When Wakeup is turned on the receiver the receiver turns on automatically when data transfer starts fx 7400GII The receiver enters the receive mode automatically after it wakes up All models except fx 7400GII When commun...

Страница 318: ...m Contents Overwrite Check 1 ALPHA MEM Alpha memory contents No CAPTURE Capture memory group CAPT n Capture memory 1 to 20 data No CONICS Conics setting data No DYNA MEM Dynamic Graph functions Yes EQUATION Equation calculation coefficient values No E CON2 E CON2 setup memory contents No FINANCIAL Financial data No F MEM Function memory group F MEM n Function memory 1 to 20 contents No G MEM Graph...

Страница 319: ... Note the following precautions whenever you perform data communications An error occurs whenever you try to send data to a receiving unit that is not yet standing by to receive data When this happens press to clear the error and try again after setting up the receiving unit to receive data An error occurs whenever the receiving unit does not receive any data approximately six minutes after it is ...

Страница 320: ...lator Basically data sent from another calculator model is received as it is However when there is a difference between an OS 2 00 calculator function and the function of the sending model the OS 2 00 calculator will convert the data as required The following provides details about data compatibility between an OS 2 00 calculator and other calculator models S Transferring Data between the fx 9860G...

Страница 321: ... calculator to a format that is supported by the receiving calculator model before it is sent GRAPH mode DYNA mode Graph Type setting data When transferring to an fx 9860G series or CFX 9850G series calculator X X X XP and XO type expressions are converted to an X c type expression Graph line type setting data When sending to a CFX 9850G series calculator line settings are converted as follows bef...

Страница 322: ...ies calculator only 3 Can be transferred to an fx 9860G series calculator only S Sending Data from an OS 2 00 Calculator to a CFX 9850G Series Calculator Sender OS 2 00 calculator Receiver CFX 9850G series The following data is not sent from an OS 2 00 calculator or is disregarded when received by the CFX 9850G series calculator Capture memory data Clipboard replay and history data Including the S...

Страница 323: ...ow x dot data Graph expressions excluding Y f x type expression Y inequalities and parametric expressions 1 Can be transferred from an OS 2 00 calculator except the fx 7400GII S Sending Data from the OS 2 00 Calculator except the fx 9750Gɉ fx 7400Gɉ to an fx 7400Gɉ fx 9860G Series CFX 9850G Series or fx 7400G Series Calculator Sender fx 9860GII SD fx 9860GII fx 9860G AU PLUS Receiver fx 9750GII fx...

Страница 324: ...s Since the Xdot value does not exist on the CFX 9850G series calculators the OS 2 00 calculator calculates it automatically from the Xmin and Xmax values they send Performing the data transfer operation changes the graph memory and dynamic graph memory setup values to their initial defaults When graph expression data is received from a CFX 9850 series calculator line settings are converted as fol...

Страница 325: ... to another calculator or computer using auto screen image send The screen displayed during data transfer The screen displayed during a calculation The screen displayed after reset is performed The low battery screen I Transferring Screen Images to a Computer Use the following procedure to transfer calculator screen images to a computer Perform this procedure using FA 124 software running on the c...

Страница 326: ...g procedure to transfer calculator screen images to a computer Perform this procedure using fx 9860G Manager PLUS software running on the computer 1 After starting up Screen Receiver on the fx 9860G Manager PLUS software use the USB cable to connect the calculator to your computer Connecting the USB cable to the calculator will cause the Select Connection Mode dialog box to appear 2 Press ScreenRe...

Страница 327: ...jector S Precautions when Connecting An hourglass figure may remain projected on the screen after you connect the calculator to a projector or YP 100 If this happens performing some operation on the calculator will restore normal display If the calculator stops operating normally disconnect the USB cable and then reconnect it If this does not correct the problem disconnect the USB cable turn the p...

Страница 328: ... data from or format a disk that is write protected Static electric charge electric noise and other phenomena can delete or corrupt card data unexpectedly Because of this you should always backup valuable data to other media CD R CD RW MO disk hard disk etc SD Logo is a trademark 1 Using an SD Card Important Always turn off the calculator before inserting or removing an SD card Note that a card ne...

Страница 329: ...lculator remove its batteries and contact your original retailer or nearest CASIO authorized service center S To remove the SD card 1 Press in on the SD card and then release it This will cause the card to pop part way out of the slot 2 Grasp the SD card with your fingers and pull it out of the slot Important Never remove the SD card while data is being transferred to it Doing so not only stops th...

Страница 330: ...Turning off the calculator When connected to a computer exiting the FA 124 software or shutting down the computer Note that an SD card needs to be oriented correctly proper side must be facing upwards the proper end must be inserted when inserting it into the calculator Trying to force an SD card into the slot when it is oriented incorrectly can damage the card and slot Use of certain SD cards whi...

Страница 331: ...og file name or delete the Prog file name if not required Nesting ERROR Nesting of subroutines by Prog file name exceeds 10 levels Ensure that Prog file name is not used to return from subroutines to main routine If used delete any unnecessary Prog file name Trace the subroutine jump destinations and ensure that no jumps are made back to the original program area Ensure that returns are made corre...

Страница 332: ... Complex Mode setting on the Setup screen even though the argument is a real number Change the Complex Mode setting to something other than Real Complex Number In List List containing complex number used in a calculation or operation for which complex number data is invalid Change all data in the list to real numbers Complex Number in Matrix Matrix containing complex number used in a calculation o...

Страница 333: ...correctly Transmit ERROR Problem with cable connection or parameter setting during data communications Check to make sure there is nothing wrong with the cable connection and that parameters are configured correctly Receive ERROR Problem with cable connection or parameter setting during data communications Check to make sure there is nothing wrong with the cable connection and that parameters are ...

Страница 334: ... Type An illegal data type is specified Specify valid data Storage Memory Full The storage memory is full Delete unneeded data No Card There is no SD card loaded in the calculator Load an SD card SD Card Full The SD card is full Delete unneeded data Invalid file name or folder name Data or folders that are supported by this calculator cannot be found on the SD card Replace the card with one that c...

Страница 335: ...x x 1 s 10100 1 x 1 s 10100 x 1 logx Inx 1 s 10 99 x 1 s 10100 Complex numbers can be used as arguments 10x ex 1 s 10100 x 100 Complex numbers can be used as arguments 1 s 10100 x 230 2585092 x x2 0 x 1 s 10100 Complex numbers can be used as arguments x 1 s 1050 1 x 3 x x 1 s 10100 x x 0 Complex numbers can be used as arguments x 1 s 10100 x 0 x 69 x is an integer nPr nCr Result 1 s 10100 n r n an...

Страница 336: ...ion calculation error is p1 at the 10th digit In the case of exponential display calculation error is p1 at the last significant digit Errors are cumulative in the case of consecutive calculations which can also cause them to become large This is also true of internal consecutive calculations that are performed in the case of xy x y x 3 x nPr nCr etc In the vicinity of a function s singular point ...

Страница 337: ...E CON2 Application ...

Страница 338: ...20051101 All of the explanations provided here assume that you are already familiar with the operating precautions terminology and operational procedures of the calculator and the EA 200 ...

Страница 339: ...ta to a program that can be run on a CFX 9850 Series fx 7400 Series calculator 4 STRT Starts data collection 5 GRPH Graphs data sampled by the EA 200 and provides tools for analyzing graphs Graph Analysis tools include calculation of periodic frequency various types of regression Fourier series calculation and more 6 HELP Displays E CON2 help Pressing the K key Setup Preview or a cursor key while ...

Страница 340: ...oices Vernier Software Technology Total Sampling Time Specify a value within the range of 0 01 second to 30 days Sampling Time Unit Select Unit Specify seconds sec minutes min hours hour or days day as the time unit of the value you input for the total sampling time Total Sampling Time Note For some sensors EA 200 built in microphone Vernier PhotoGate etc sampling parameters are different from tho...

Страница 341: ...e setup press J QUIT 1 Display the E CON2 main menu page 1 1 2 Press 1 SET and then 1 WIZ This launches the Setup Wizard and displays the Select Sensor screen 2 2 Using the Setup Wizard 3 Press 1 to specify a CASIO sensor or 2 to specify a Vernier sensor Pressing either key will display the corresponding sensor list The following shows the sensor list that appears when you press 1 4 Specify the se...

Страница 342: ... to specify the unit seconds minutes hours days of the value you input here Note With some sensors CASIO Microphone Sound wave etc sampling time is limited to a few seconds The unit for such a sensor is always seconds and so the Select Unit screen does not appear If you specify a total sampling time value in the range of 10 seconds to 23 hours 59 minutes 59 seconds real time graphing will be perfo...

Страница 343: ...w to specify what you want to do with the setup you have configured b Start Setup Starts sampling using the setup page 8 1 c Save Setup MEM Saves the setup page 6 1 d Convert Program Converts the setup to a program page 7 1 9 If there is not problem with the contents of the confirmation screen press 1 If you need to change the setup press 6 or J This will return to the screen in step 4 for setting...

Страница 344: ...crophone FFT only This causes a Select FFT Range screen to appear You can select one of four settings for FFT Range The setting you select will automatically apply the applicable fixed parameters shown below Setting Parameter Frequency pitch Frequency max Sampling interval Number of samples 2 Hz 1000 Hz 8192 2 1000 Hz 1 61 sec μ 4 Hz 2000 Hz 8192 4 2000 Hz 2 31 sec μ 6 Hz 3000 Hz 8192 6 3000 Hz 3 ...

Страница 345: ...ify whether PhotoGate is connected to the CH1 or SONIC channel 3 Press 1 to specify CH1 or 2 to specify SONIC This causes a Gate Status screen to appear Open means the photo path is not blocked while Close means the photo path is blocked The gate status defines what PhotoGate status should cause timing to start and what status should cause timing to stop Open Open Timing starts when the gate opens...

Страница 346: ...tup using Setup Wizard on page 2 2 2 On the Select Sensor screen select VERNIER Photogate Pulley This causes an Input Distance m screen to appear The distance you specify here is the distance the weight travels after it is released Input a value in the range of 0 1 to 4 to specify the distance in meters 3 Perform step 10 under To configure an EA 200 setup using Setup Wizard on page 2 2 to finalize...

Страница 347: ...ation port of the calculator and the MASTER port of the EA 200 2 Perform the first two steps of the procedure under To configure an EA 200 setup using Setup Wizard on page 2 2 3 On the Select Sensor screen select CASIO Speaker y f x This displays a screen like the one shown below 4 Press w to advance to the View Window setting screen The following settings are configured automatically Ymin 1 5 and...

Страница 348: ...n below appears on the display 10 Input a percent value for the output frequency value you want To output the original sound as is specify 100 To raise the original sound by one octave input a value of 200 To lower the original sound by one octave input a value of 50 11 After inputting an output frequency value press w This outputs the waveform between the start point and end point from the EA 200...

Страница 349: ...Next repeat the above steps from step 10 To change the output range of the waveform graph and try again Press 6 No to return to the graph screen in step 7 Next repeat the above steps from step 8 To change the function Press 6 No and then J to return to the graph function list in step 6 Next repeat the above steps from step 6 To exit the procedure and return to the E CON2 main menu Press 6 No and t...

Страница 350: ...e Advanced Setup menu 4 If you want to configure a custom probe at this point press f Custom Probe Next follow the steps under To configure a custom probe setup on page 4 1 You can also configure a custom probe during the procedure under To configure Channel Setup settings on page 3 3 Custom probe configurations you have stored in memory can be selected using Channel in step 5 below 5 Use the Adva...

Страница 351: ...etup page 8 1 2 MLTI Starts MULTIMETER Mode sampling using the setup page 5 1 3 MEM Saves the setup page 6 1 4 PROG Converts the setup to a program page 7 1 5 GRPH Graphs data sampled by the EA 200 and provides tools for analyzing graphs page 10 1 6 ABT Displays version information about the EA 200 unit that is currently connected to the calculator u To return setup parameters to their initial def...

Страница 352: ...e selected channel 1 CASIO Displays a menu of CASIO sensors 2 VRNR Displays a menu of Vernier sensors 3 CSTM Displays a menu of custom probes 4 None Press this key when you want leave the channel without any sensor assigned to it SONIC Channel Press a function key to display a menu of sensors that can be assigned to this channel 1 CASIO Displays a menu of CASIO sensors but only Motion can be selec...

Страница 353: ...cessary to configure all the channels you want 5 After all the settings are the way you want press w This returns to the Advanced Setup menu Note When you select a channel on the Channel Setup screen the sampling range of the selected channel appears in the bottom line of the screen In the above example the range of the temperature sensor assigned to CH2 appears on the display If the sampling rang...

Страница 354: ...k Period CH1 Perform sampling over a long time weather etc The EA 200 enters a power off sleep state while standing by Press this key To do this To select this mode 1 R T Normal Graph data in real time as it is sampled 4 Extd Period 2 Fast Clock Perform sampling of high speed phenomena sound etc 6 g 1 Snd Sound Sample sound using the EA 200 s built in microphone 6 g 2 Clck Extended Record the time...

Страница 355: ...The Warm up setting will not be displayed on the Sample Setup screen if Fast Sound or Extended is currently selected as the sampling mode Important When the following condition exists an FFT Graph setting appears in place of the Warm up setting See To configure the FFT Graph setting page 3 7 for information about configuring the FFT Graph setting Sampling Mode page 3 5 Fast To do this Press this k...

Страница 356: ...els that can be selected for each sampling mode see step 2 of To configure Sample Setup settings For information about the trigger sources that can be selected for each sampling mode see Trigger Setup page 3 8 u u u u u To configure the Distance setting In place of step 3 of the procedure under To configure Sample Setup settings press 1 to display a dialog box for specifying the distance the weigh...

Страница 357: ...1 Period CH1 k Trigger Setup You can use the Trigger Setup screen to specify the event that causes sampling to start w key operation etc The event that causes sampling to start is called the trigger source which is indicated as Source on the Trigger Setup screen To start sampling when this happens Select this trigger source After the specified number of seconds are counted down Count Down When the...

Страница 358: ...u items that appears in the menu bar depend on the sampling mode selected with Sample Setup page 3 5 The above screen shows the function menu when Normal is selected as the sample sampling mode 2 Use the function keys to select the trigger source you want The following shows the trigger sources that can be selected for each sampling mode Sampling Mode Trigger Source Realtime 1 EXE EXE key 2 Cnt Co...

Страница 359: ...cify microphone sensitivity See To specify microphone sensitivity below START key Press w to finalize Trigger Setup and return to the Advanced Setup menu u u u u u To specify the countdown start time 1 Move the highlighting to Timer 2 Press 1 Time to display a dialog box for specifying the countdown start time 3 Input a value in seconds from 1 to 10 4 Press w to finalize Trigger Setup and return t...

Страница 360: ...tings Perform the following steps when Period is specified as the sampling mode page 3 5 1 Move the highlighting to Threshold 2 Press 1 EDIT to display a dialog box for specifying the trigger threshold value which is value that data needs to attain before sampling starts 3 Input the value you want 4 Move the highlighting to Start to 5 Press one of the function keys described below To select this t...

Страница 361: ...lue and motion sensor level 1 Move the highlighting to Threshold 2 Press 1 EDIT to display a dialog box for specifying the trigger threshold value which is value that data needs to attain before sampling starts 3 Input the value you want and then press w 4 Move the highlighting to Level 5 Press one of the function keys described below To specify this PhotoGate status Press this key PhotoGate close...

Страница 362: ...urrent data area the channel name appears Note For details about sample data memory and current data area see 9 Using Sample Data Memory 2 To change the graph source data name display setting use the f and c cursor keys to move the highlighting to Graph Func Next press one of the function keys described below 3 To change the trace operation coordinate display setting use the f and c cursor keys to...

Страница 363: ...eal time scrolling on 1 On Real time scrolling off 2 Off 5 To change the real time scroll setting use the f and c cursor keys to move the highlighting to RealScroll Next press one of the function keys described below 6 Press w to finalize Graph Setup and return to the Advanced Setup menu 20070101 ...

Страница 364: ...CON2 main menu page 1 1 press 1 SET and then c ADV to display the Advanced Setup menu See 3 Using Advanced Setup for more information 2 On the Advanced Setup menu page 3 1 press f Custom Probe to display the Custom Probe List The message No Custom Probe appears if the Custom Probe List is empty 3 Press 2 NEW This displays a custom probe setup screen like the one shown below 4 1 Using a Custom Prob...

Страница 365: ...nput a memory number 1 to 99 This saves the custom probe setup and returns to the Custom Probe List which should now contain the new custom probe setup you configured u u u u u To recall the specifications of a Vernier sensor and configure custom probe settings 1 Perform the first two steps of the procedure under To configure a custom probe setup on page 4 1 2 Press 5 VRNR This displays a Vernier ...

Страница 366: ...tom probe you want to auto calibrate to CH1 of the EA 200 2 What you should do first depends on whether you are configuring a new custom probe for calibration or editing the configuration of an existing custom probe If you are configuring a new custom probe Perform steps 1 through 6 of the procedure under To configure a custom probe setup on page 4 1 Auto calibrate will automatically set the slope...

Страница 367: ... that appeared in step 3 6 After the sampled value stabilizes hold down w for a few seconds This will register the second sampled value and display it on the screen The cursor will appear at the bottom of the display ready for input of a reference value Second sampling operation 7 Use the key pad to input the reference value for the second sampled value and then press w This will return to the cus...

Страница 368: ...onfiguring a new custom probe for zero adjusting or editing the configuration of an existing custom probe If you are configuring a new custom probe Perform steps 1 through 6 of the procedure under To configure a custom probe setup on page 4 1 Auto calibrate will automatically set the intercept so you do not need to specify it in step 6 of the above procedure If you are editing the configuration of...

Страница 369: ... a custom probe setup 1 Display the Custom Probe List 2 Select the custom probe setup whose configuration you want to edit Use the f and c cursor keys to highlight the name of the custom probe you want 3 Press 3 EDIT This displays the screen for configuring a custom probe setup To edit the custom probe setup perform the procedure starting from step 6 under To configure a custom probe setup on page...

Страница 370: ...age 3 1 use the Channel Setup screen page 3 3 to configure sensor setups for each channel you will be using 3 After configuring the sensor setups press w to return to the Advanced Setup menu page 3 1 and then press 2 MLTI This starts sampling in the EA 200 MULTIMETER mode and displays a list of sample values for each channel Displayed sample data is refreshed at 0 5 second intervals Do not connect...

Страница 371: ...anced Setup See step 6 under To configure an EA 200 setup using Advanced Setup on page 3 1 for more information While the E CON2 main menu page 1 1 is on the display Performing the setup save operation while the E CON2 main menu is on the display saves the contents of the current setup memory area which were configured using Setup Wizard or Advanced Setup Details on saving a setup are listed below...

Страница 372: ...returns to the setup memory list which includes the name you assigned it Important Since you assign both a setup name and a file number to each setup you can assign the same name to multiple setups if you want k Using and Managing Setups in Setup Memory All of the setups you save are shown in the setup memory list After selecting a setup in the list you can use it to sample data or you can edit it...

Страница 373: ... to the confirmation message that appears press 1 Pressing w sets up the EA 200 and then starts sampling To clear the confirmation message without sampling press 6 Note See Operations during a sampling operation on page 8 2 for information about operations you can perform while a sampling operation is in progress u To change the name of setup data 1 On the E CON2 main menu page 1 1 press 2 MEM to ...

Страница 374: ...ory area You can then use Advanced Setup to edit the setup This capability comes in handy when you need to perform a setup that is slightly different from one you have stored in memory 1 On the E CON2 main menu page 1 1 press 2 MEM to display the setup memory list 2 Use the f and c cursor keys to highlight the name of the setup you want 3 Press 5 LOAD 4 In response to the confirmation message that...

Страница 375: ...rd on page 2 2 After configuring a new setup with Advanced Setup See step 6 under To configure an EA 200 setup using Advanced Setup on page 3 1 for more information While the E CON2 main menu page 1 1 is on the display Performing the program converter operation while the E CON2 main menu is on the display converts the contents of the current setup memory area which were configured using Setup Wiza...

Страница 376: ... of the program converter screen Note For information about 1 CALC 4 38K see Converting a CFX 9850 Series Program to a fx 9860 Series Compatible Program page 7 4 4 Specify the Data Analyzer model EA 100 or EA 200 to be associated with the program Perform one of the following key operations to associate the program with a Data Analyzer To associate the program with this Data Analyzer Perform this k...

Страница 377: ...o adjust of the CH1 custom probe To perform this operation Perform this key operation Calibration of the CH1 custom probe 3 CALB 1 CALIB No calibration 3 CALB 3 None 3 CALB 2 ZERO 7 Enter up to eight characters for the password If you change your mind about assigning a password press J here This will cause the password input field to disappear and cancel password input 8 After everything is the wa...

Страница 378: ...omplete 7 4 Using Program Converter EA 200 Control Program for CFX 9850 Series EA 200 Control Program for fx 9860 Series Convert u To convert a program 1 Transfer the EA 200 control program created for the CFX 9850 Series to the fx 9860 main memory Use the cable that comes bundled with the fx 9860 to connect its 3 pin serial port to the 3 pin serial port of the CFX 9850 For details see the chapter...

Страница 379: ...word protect the program perform steps 6 and 7 under To convert a setup to a program after inputting the program name 6 Press w to start conversion of the program The message Complete appears when conversion is complete To clear the message press w or J 7 5 Using Program Converter ...

Страница 380: ...izard See step 8 under To configure an EA 200 setup using Setup Wizard on page 2 2 After configuring a new setup with Advanced Setup See step 6 under To configure an EA 200 setup using Advanced Setup on page 3 1 While the E CON2 main menu page 1 1 is on the display Starting a sampling operation while the E CON2 main menu is on the display performs sampling using the contents of the current setup m...

Страница 381: ...200 setup is in progress You can cancel the setup operation any time this message is displayed by pressing A The screen shown below appears after EA 200 setup is complete 8 2 Starting a Sampling Operation 3 Press w to start sampling The screens that appear while sampling is in progress and after sampling is complete depend on setup details sampling mode trigger setup etc For details see Operations...

Страница 382: ...lues but only a partial preview Pressing 1 advances to 4 Graphing Pressing w there returns to 3 Sampling w w w w The following three graph types can be produced when Photo Gate Pulley is being used 1 Time and distance graph 2 Time and velocity graph 3 Time and acceleration graph Sample values is stored as List data only When Number of Samples 1 When Number of Samples 1 Input values w Sampled value...

Страница 383: ...sampled data If you want to save a set of current data and keep it from being replaced by a new sampling operation save the data in sample data memory under a different file name k Managing Sample Data Files u u u u u To save current sample data to a file 1 On the E CON2 main menu page 1 1 press 5 GRPH This displays the Graph Mode screen For details about the Graph Mode screen see 10 Using the Gra...

Страница 384: ...place the existing data file or 6 to return to the memory number input dialog box in Step 4 6 To return to the E CON2 main menu page 1 1 press J twice Note You could select another data file besides a current data file in step 3 of the above procedure and save it under a different memory number You do not need to change the file s name as long as you use a different file number 9 2 Using Sample Da...

Страница 385: ...his returns to the Sampling Data List screen 5 To return to the E CON2 main menu page 1 1 press J twice u u u u u To delete a sample data file 1 On the E CON2 main menu page 1 1 press 5 GRPH This displays the Graph Mode screen 2 Press 2 DATA This displays the Sampling Data List screen 3 Use the f and c cursor keys to move the highlighting to the data file you want to delete and then press 4 DEL 4 ...

Страница 386: ...er you perform a sampling operation Press 5 GRPH at that time When you access Graph Analysis tools using this method you can select from among a variety of other Analysis modes See Selecting an Analysis Mode and Drawing a Graph page 10 2 for more information about the other Analysis modes u u u u u Accessing Graph Analysis tools from the screen of a graph drawn after a sampling operation is execut...

Страница 387: ... appears in the top line of the Graph Mode screen 10 2 Using the Graph Analysis Tools to Graph Data Analysis mode name 3 Press 2 DATA This displays the Sampling Data List screen Graph three sets of sampled data simultaneously Norm Perform this menu operation To do this To select this mode Graph Analysis Graph sampled data along with its first and second derivative graph diff d dt d2 dt2 Display th...

Страница 388: ... the name of the sample data file you selected b Repeat step a above to specify sample data files for other graphs if there are any If you select Graph Analysis as the analysis mode in step 2 you must specify sample data files for three graphs If you select Compare Graph as the analysis mode in step 2 you must specify sample data files for two graphs With other modes you need to specify only one s...

Страница 389: ... 1 Line graph with X data markers 3 2 Scatter graph with dot data markers 4 Scatter graph with square data markers 5 Scatter graph with X data markers 6 When a Graph screen is on the display the function keys provide you with zooming and other capabilities to aid in graph analysis For details about Graph screen function key operations see the following section u u u u u To deselect sampled data as...

Страница 390: ...ing Trace on page 11 3 Displays a function menu of special View Window commands for the E CON2 Mode graph screen For details about each command see Configuring View Window Parameters on page 11 14 2 ZOOM 3 V WIN Starts a zoom operation which you can use to enlarge or reduce the size of the graph along the x axis or the y axis See Using Zoom on page 11 4 K1 PICT Saves the currently displayed graph ...

Страница 391: ...screen contains multiple graphs See Working with Multiple Graphs on page 11 10 Starts an operation for outputting a specific range of a sound data waveform graph from the speaker See Outputting a Specific Range of a Graph from the Speaker on page 11 12 K3 EDIT K6 SPKR Displays a menu that lets you transform a sample result graph to a function using Fourier series expansion and to perform regressio...

Страница 392: ...t trace pointer location are also shown on the display 2 Use the d and e cursor keys to move the trace pointer along the graph to the location you want The coordinate values change in accordance with the trace pointer movement You can exit the trace pointer at any time by pressing J u u u u u To obtain the periodic frequency value 1 Use the procedure under To use trace above to start a trace opera...

Страница 393: ...out using Alpha Memory see the manual that comes with the fx 9860G SD fx 9860G calculator k Using Zoom Zoom lets you enlarge or reduce the size of the graph along the x axis or the y axis Note When there are multiple graphs on the screen the procedure below zooms all of them For information about zooming a particular graph when there are multiple graphs on the screen see Working with Multiple Grap...

Страница 394: ...of the range you want to convert to list data and then press w 11 5 Graph Analysis Tool Graph Screen Operations To do this Press this cursor key Reduce the size of the graph image horizontally d Enlarge the graph image horizontally e Reduce the size of the graph image vertically c Enlarge the graph image vertically f 4 Move the trace pointer to the end point of the range you want to convert to lis...

Страница 395: ...pansion to Transform a Waveform to a Function Fourier series expansion is effective for studying sounds by expressing them as functions The procedure below assumes that there is a graph of sampled sound data already on the graph screen u u u u u To perform Fourier series expansion 1 On the graph screen press K and then 4 CALC The CALC menu appears at the bottom of the display 11 6 Graph Analysis T...

Страница 396: ...ion list appears with the calculation result 11 7 Graph Analysis Tool Graph Screen Operations 7 Pressing 6 DRAW here graphs the function This lets you compare the expanded function graph and the original graph to see if they are the same Note When you press 6 DRAW in step 7 the graph of the result of the Fourier series expansion may not align correctly with the original graph on which it is overla...

Страница 397: ...n The same general steps can also be used to perform the other types of regression u u u u u To perform quadratic regression 1 On the graph screen press K and then 4 CALC The CALC menu appears at the bottom of the display 2 Press 5 X 2 This displays the trace pointer for selecting the range on the graph 3 Move the trace pointer to the start point of the range for which you want to perform quadrati...

Страница 398: ... graph function list Any functions you have previously input on the graph function list appear at this time 11 9 Graph Analysis Tool Graph Screen Operations 2 Input the function you want to graph To input a function use the f and c cursor keys to move the highlighting to the line where you want to input it and then use the calculator keys for input Press w to store the function 3 On the graph func...

Страница 399: ...and then 1 Cls Important The screenshot shown in step 4 above is of a function that was calculated and stored by performing regression on a graph that was drawn using sampled data Note that overlaying a Y f x graph on a sampled data graph does not automatically draw a regression graph based on sampled data k Working with Multiple Graphs The procedures in this section explain how you can zoom or mo...

Страница 400: ...s to move the magnifying glass cursor to the location on the screen that you want at the center of the enlarged or reduced screen 5 Press w This causes the magnifying glass to disappear and enters the zoom mode The cursor keys perform the following operations in the zoom mode 6 To exit the zoom mode press J To do this Press this cursor key Reduce the size of the graph image horizontally d Enlarge ...

Страница 401: ...and then 4 SPKR This displays the trace pointer for selecting the range on the graph u u u u u To move a particular graph on a multi graph display 1 When the graph screen contains multiple graphs press K and then 3 EDIT This displays the EDIT menu 2 Press 2 MOVE This displays only one of the graphs that were originally on the graph screen 3 Use the f and c cursor keys to cycle through the graphs u...

Страница 402: ...ppear If this happens press J to scroll back through the previous setting screens and change the setup as required 6 To terminate sound output press the EA 200 START STOP key 7 Press w This displays a screen like the one shown below 3 Move the trace pointer to the end point of the range you want to output from the speaker and then press w After you specify the start point and end point an output f...

Страница 403: ...ew Window parameters Y axis Elements In accordance with screen size X axis Elements In accordance with screen size when 1 data item equals 1 dot 1 data equals 1 dot in other cases Resizes the graph so all of it fits in the screen along the Y axis without changing the X axis dimensions Specifies the unit of the numeric axis grid displayed by the Econ Axes setting of the graph setup screen page 3 13...

Страница 404: ...am converter including detailed EA 200 setup and sampling execution graphing and Graph Analysis Tools simultaneous sampling with multiple sensors using the MULTIMETER Mode etc uEcon Sampling strip This strip records on set of EA 200 setup information configured using Advanced Setup and performs sampling Once setup information is recorded to this type of strip sampling starts immediately based on t...

Страница 405: ...an Econ Strip into an eActivity file 1 On the eActivity workspace screen move the cursor the location where you want to insert the Econ strip 2 Press 2 STRP This will display a dialog box with a list of insertable strips 12 2 Calling E CON2 Functions from an eActivity 3 Use f and c to move the highlighting to the type of Econ strip you want to insert See the beginning of this section page 12 1 for...

Страница 406: ...perations for each type of Econ strip that can be inserted into an eActivity file The following procedure assumes that the applicable Econ strip has already been inserted into an eActivity that is currently open u u u u u To access the Setup Wizard from an Econ SetupWizard strip 1 On the eActivity workspace screen use the f and c keys to move the highlighting to the Econ SetupWizard strip 12 3 Cal...

Страница 407: ... keys to move the highlighting to the Econ Advanced Setup strip 2 Press w This displays the Advanced Setup screen 12 4 Calling E CON2 Functions from an eActivity From here perform the procedure under To configure an EA 200 setup using Advanced Setup page 3 1 from step 4 To return to the eActivity workspace screen after you finished the procedure or at any point during the procedure press a Note Us...

Страница 408: ...at you have used for sampling in the paste and want to re execute with the same setup jump to step 8 3 Press to display the application list 4 Use the f and c cursor keys to move the highlighting to Econ AdvancSetup and then press w This displays the Advanced Setup screen 5 Perform steps 4 and 5 under To configure an EA 200 setup using Advanced Setup page 3 1 to configure the setup for sampling 6 ...

Страница 409: ...s to move the highlighting to the Econ Graph strip 2 Press w If this Econ Graph strip already has sampled data registered to it because of a previous execution a graph of the existing data will appear on the display In this case jump to step 5 of this procedure If this is the first time you are executing this Econ Graph strip the Advanced Setup screen will appear on the display If this happens pro...

Страница 410: ...o be exceeded Always make sure that FFT Graph is turned off whenever performing sampling with the microphone Leaving FFT Graph turned on cause memory capacity to be exceeded If an error occurs press a to return to the eActivity workspace screen and perform the procedure again For information about checking the memory usage of each strip see 10 5 eActivity File Memory Usage Screen in the manual tha...

Страница 411: ...r CASIO COMPUTER CO LTD 6 2 Hon machi 1 chome Shibuya ku Tokyo 151 8543 Japan Responsible within the European Union CASIO EUROPE GmbH Casio Platz 1 22848 Norderstedt Germany This mark applies in EU countries only ...

Страница 412: ...CASIO COMPUTER CO LTD 6 2 Hon machi 1 chome Shibuya ku Tokyo 151 8543 Japan One or more of the following patents may be used in the product U S Pats 5 166 897 5 210 708 5 535 317 5 539 867 SA0902 A ...

Отзывы: