136
ADVANCED SETTINGS
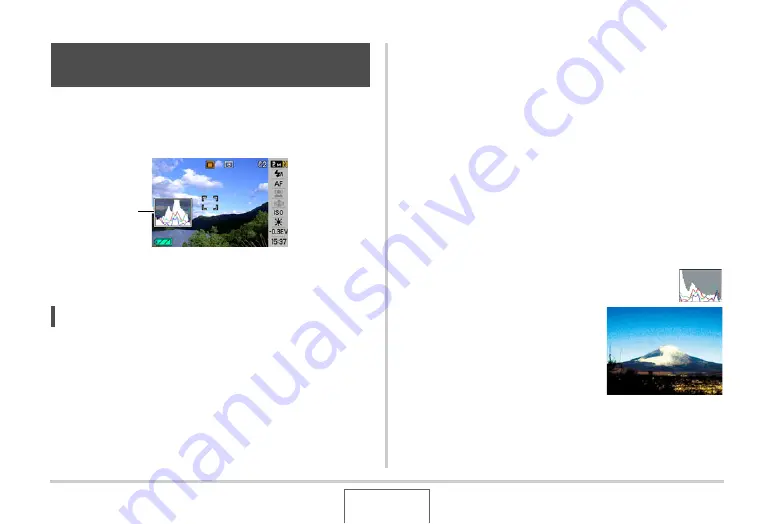
The on-screen histogram that pro
v
ides a graphic representation
of the c
u
rrent expos
u
re of the image. Yo
u
can also display the
histogram in the PLAY mode for information a
b
o
u
t the expos
u
re
le
v
els of images.
1.
Press [
S
] (DISP) as many times as necessary
to display the histogram (page 56).
NOTE
•
Yo
u
can
u
se key c
u
stomization to config
u
re the [
W
] and [
X
]
bu
ttons so they control the EV shift setting. Then yo
u
can
perform EV shift
w
hile
v
ie
w
ing the res
u
lts on the on-screen
histogram (page 13
■
How to Use the Histogram
A histogram is a graph that represents the lightness of an image
in terms of the n
u
m
b
er of pixels. The
v
ertical axis indicates the
n
u
m
b
er of pixels,
w
hile the horizontal axis indicates lightness. If
the histogram appears too lopsided for some reason, yo
u
can
u
se EV shift to mo
v
e it left or right in order to achie
v
e
b
etter
b
alance. Optim
u
m expos
u
re can
b
e achie
v
ed
b
y EV shifting so
the graph is as close to the center as possi
b
le. For snapshots,
yo
u
can e
v
en display indi
v
id
u
al histograms for R (red), G
(green), and B (
b
l
u
e). These lines can
b
e
u
sed to determine
w
hether there is too m
u
ch or too little of each of the color
components in an image.
Example Histograms
A histogram to
w
ards the left side
res
u
lts
w
hen the o
v
erall image is
dark. A histogram that is too far to the
left may res
u
lt in “
b
lack o
u
t” of the
dark areas of an image, as sho
w
n in
the near
b
y image.
Using the On-screen Histogram to
Check Exposure
Histogram


