


CR10X Reference Manual
11-10
Minimize instruction should only refer to that input location (i.e. there should
only be one repetition).
PARAM.
DATA
NUMBER TYPE
DESCRIPTION
01:
2
Repetitions (number of sequential locations to sample)
02:
4
Starting input location no.
Outputs Generated:
1 per repetition
Instruction 80: Set Active Storage Area
Instruction 80 is used to redirect output data to either of the Final Storage areas or
to Input Storage and to set the array ID for Final Storage. At the beginning of each
program table the active output area defaults to Final Storage Area 1.
When output is directed to Final Storage, the second parameter can be used to set
the output array ID. In this case Instruction 80 should follow the instruction
setting the Output Flag (flag 0). If parameter 2 is 0, the array ID is determined by
the instruction location number of Instruction 80 or by the instruction that set the
Output Flag, whichever comes last. When data is sent to Input Storage, no array
ID is sent. Output array IDs can be indexed within a loop.
PARAM.
DATA
NUMBER TYPE
DESCRIPTION
01:
2
Storage area option
00 or 01 = Final Storage Area 1
02 = Final Storage Area 2
03 = Input Storage Area
02:
4
Starting input location destination if option 03; Output
Array ID if options 0-2 (1-511 are valid IDs)
Instruction 81: Rainflow Histogram
Instruction 81 implements the rainflow counting algorithm, essential to estimating
cumulative damage fatigue to components undergoing stress/strain cycles. Data is
provided by making measurements in either the standard or the Burst Mode. The
Rainflow instruction can either process a swath of data following the Burst Mode,
or it can process ‘on line’ similar to other processing instructions.
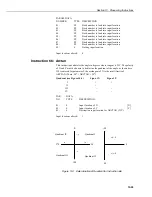
The output is a two-dimensional Rainflow Histogram for each sensor or
repetition. One dimension is the amplitude of the closed loop cycle (i.e. the
distance between peak and valley); the other dimension is the mean of the cycle
(i.e. [peak value + valley value]/2). The value of each element (bin) of the
histogram can be either the actual number of closed loop cycles that had the
amplitude and average value associated with that bin or the fraction of the total
number of cycles counted that were associated with that bin (i.e. number of cycles
in bin divided by total number of cycles counted).
The user enters the number of mean bins, the number of amplitude bins, and the
upper and lower limits of the input data.
The values for the amplitude bins are determined by the difference between the
upper and lower limits on the input data and by the number of bins. For example,
if the lower limit is 10 and the upper limit is 150 and there are five amplitude bins,
the maximum amplitude is 150 - 100 = 50. The amplitude change between bins