CR10X User Guide
8-22
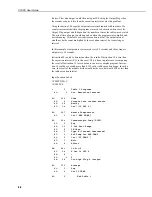
19:
P92
If time is
01:
0
minutes (seconds--) into a
02:
30
minute or second interval
03:
10
Set high Flag 0 (output)
20:
P62
Covariance/Correlation
01:
5
No. of Input Values
02:
5
No. of Means
03:
5
No. of Variances
04:
0
No. of Std. Dev.
05:
4
No. of Covariances
06:
2
No. of Correlations
07:
300
Samples per Average
08:
1
First Sample Loc W1
09:
20
Loc [:MEAN
_
W1 ]
21:
P62
Covariance/Correlation
01:
5
No. of Input Values
02:
5
No. of Means
03:
5
No. of Variances
04:
0
No. of Std. Dev.
05:
9
No. of Covariances
06:
2
No. of Correlations
07:
300
Samples per Average
08:
11
First Sample Loc W2
_
i
09:
36
Loc [:MEAN
_
W2 ]
22: P77
Real
Time
01:
0110
Day,Hour-Minute
23:
P70
Sample
01:
35
Reps
02:
20
Loc MEAN_W1
24:
P
End Table 1
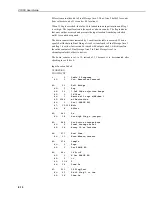
Table 8-4 Thirty-Minute Output from Example
01 119
02 DAY
03 HRMIN
04 M(W1)
05 M(U1)
06 M(V1)
07 M(Ta1)
08 M(e1)
09 V(W1)
10 V(U1)
11 V(V1)
12 V(Ta1)
13 V(e1)
14 CV(W1,U1) 15 CV(W1,V1) 16 CV(W1,Ta1)
17 CV(W1,e1)
18 CR(W1,U1)
19 CR(W1,V1) 20 M(W2)
21 M(U2)
22 M(V2)
23 M(Ta2)
24 M(e2)
25 V(W2)
26 V(U2)
27 V(V2)
28 V(Ta2)
29 V(e2)
30 CV(W2,U2) 31 CV(W2,V2) 32 CV(W2,Ta2)
33 CV(W2,e2)
34 CV(U2,V2)
35 CV(U2,Ta2) 36 CV(U2,e2) 37 CV(V2,Ta2) 38 CV(V2,e2)
8.11 Fast Fourier Transform Examples
Example without Bin Averaging
The CR10X was used to generate data representing two superimposed sine wave
signals, one at 1.25Hz (amplitude = 1) and the other at 0.25Hz (amplitude = 2).
The 1024 generated samples simulate a sampling rate of 10Hz or a 0.1 second
scan rate. Figure 8-3 shows a plot of the simulated signal. The FFT was applied to
the data and real and imaginary, phase and magnitude, and power spectra results
are shown in Tables 8-5, 8-6 and 8-7 respectively. A portion of the power spectra
results is illustrated in Figure 8-4.


