128
>>>
TOOLS
Slide show
In the slide show, all the pictures in the
current folder level are automatically
displayed sequentially.
>
Press
Slide show
in the image viewer
menu.
The image display changes to full screen
display and initiates the slide show
according to the settings made, with the
first image in the current folder level.
The slide show will end once all images
have been displayed.
Press the
button to stop the show
before the end.
Settings
In the settings, you can choose the speed
at which the images are displayed,
whether certain effects are used when a
new image is shown, and whether the
images should be loaded at a higher
quality.
>
Press
Slide show settings
in the
image viewer menu.
>
You can use
Interval time
to set the
display duration.
>
In
Effects
you can choose the
transition effects for the images.
>
In
Load pictures in high quality
(slower)
you can choose whether
images should be loaded at high
resolution (
) or not (
).
Loading the images at high resolution
makes the display slower.
>
Confirm your settings by pressing the
back button
.
Where am I?
>
See "Displaying current position
(Where am I?)" on page 105.
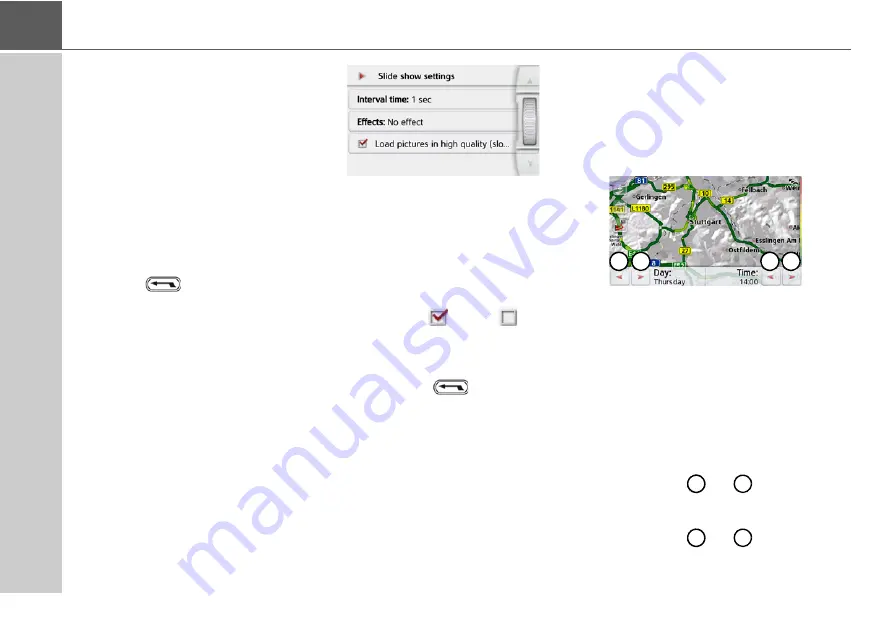
Traffic forecast (depending on model)
With the traffic forecast, you can observe
the expected flow of traffic.
The data is based on historical traffic
data collected over a longer period of
time.
You can determine the expected flow of
traffic by the colour of the road. Green
signifies a clear road, red signifies con-
gestion. All possible colours are dis-
played on the right-hand side of the
screen.
If you now change the time of day, you
will see how the expected flow of traffic
changes.
>
Press the
Traffic forecast
button
• With the
and
buttons you
can change the weekday
• With the
and
buttons you
can change the time in hourly
increments
1
2
3
4
1
2
3
4
Содержание active.5s EU
Страница 1: ...OPERATING GUIDE ...
Страница 156: ...156 NOTICE ...
Страница 157: ...3LGRCBÍ TGE RGMLÍ K J ͱ ͱEͱ LJ Á Á KL E JG Germany UUU KW CAICP AMK FMI 12229 ...


