Edge
Profile
The Edge
Profile
graph changes depending on which threshold type is selected. Refer to the Threshold
section
and the
specific
threshold
types for details on the Edge
Profile
graph.
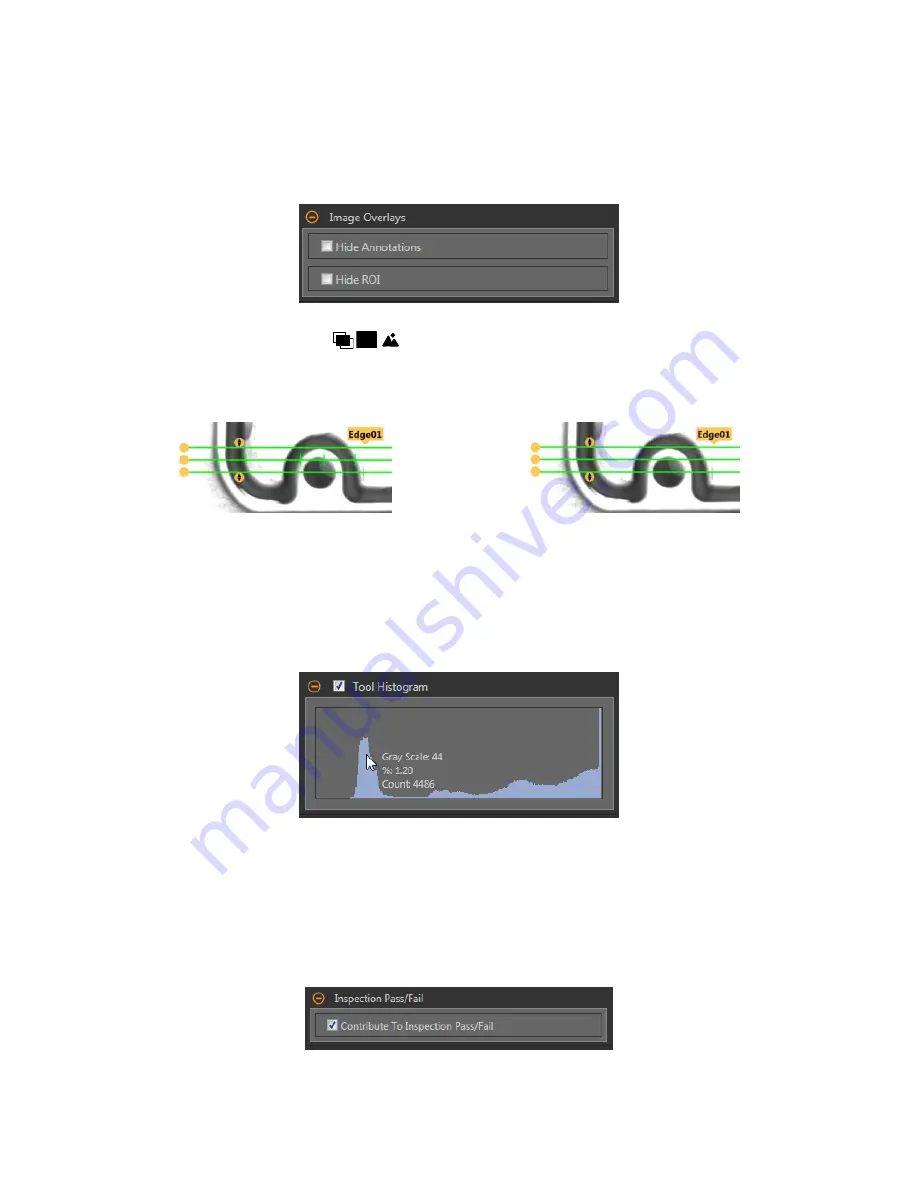
Image Overlays
Choose whether to display or hide the
annotations
or the ROI when this tool is not selected.
Figure 155. Image Overlays—Default
These
options
override the ROI view
buttons
on the Image Pane Parameters when no tool is selected. When a
specific
tool
is selected, the ROI
information
is shown.
Hide
Annotations
Hides the
annotations
on the live image for the tool, even when the tool is selected.
Figure 156. Show Edge Tool
Annotations
Figure 157. Hide Edge Tool
Annotations
Hide ROI
Hides the ROI when the tool is not selected.
Tool Histogram
The Tool Histogram graphically displays pixel intensity
information
within the current ROI.
Figure 158. Example Histogram
Select the Tool Histogram checkbox to enable the histogram. The default is enabled. Expand the Tool Histogram parameter to view the
histogram.
The histogram is a display of the grayscale values on the x axis and the number of pixels on the y axis. The histogram displays the
amount of pixels for each grayscale value. The graph displays
information
for all grayscale values (0 to 255). Move the pointer anywhere
over the histogram to view
specific
information.
The
information
updates as the
position
of the pointer changes.
Inspection
Pass/Fail
Select the Contribute to
Inspection
Pass/Fail check box (default) if the tool will
influence
the Pass/Fail status of the
inspection.
Figure 159.
Inspection
Pass/Fail
The Pass/Fail
contribution
influences
the following:
VE Series Smart Camera
92
www.bannerengineering.com - Tel: 763.544.3164


