2.3.2b Graphing data
The PanaView network tree has already been described, and
the display pane shows only a graph in the default style with
no data points. The bottom right pane enables you to set up
the graph. To begin graphing your data, proceed as follows:
1. Expand the network tree as far as necessary and double
click on the process parameter to be graphed. The grid
for the selected graph appears in the display pane, with
time
as the x-axis and the parameter
value
as the y-axis.
In addition, a
legend
appears above the graph, which
indicates the name, data point shape and line color for
that parameter.
2. If desired, a second parameter may be added to the
graph by repeating step 1. In this case, the parameter
“
value
” is shown as a
right
y-axis (Y2).
NOTE:
Although only two parameters may be graphed for
any one meter channel, the same two parameters may also
be graphed for any other active meter channels.
3. To begin plotting data for the selected parameter(s),
enter a time
Interval
for data sampling in the text box
provided (the default value is 5 seconds).
4. Click on the [plot continuous] control button to begin
graphing the selected process parameter(s) as a
function of time, at the interval specified in step 3.
5. While PanaView is graphing the data, the following
actions may be taken from the control pane:
• change the sampling interval by entering a new value
• click on the zoom out] control button to increase the
size of the intervals shown on the x-axis
• click on the zoom In] control button to decrease the
size of the intervals shown on the x-axis
NOTE:
The zoom buttons may be clicked multiple times to
enhance the effect.
• click on the
text display
tab to view the data being
graphed in the text format described in the previous
section
When you have finished graphing your data, click on the
[stop] control button, which has replaced the original [plot
continuous] control button.
For further information on setting up graph properties,
refer to
Chapter 5, displaying data
, of the
PanaView user’s
manual
.
2.3.3 Displaying transducer signals
Along with flow rate data, PanaView enables XGF868i users
to read and plot transducer signals from the XGF868i.
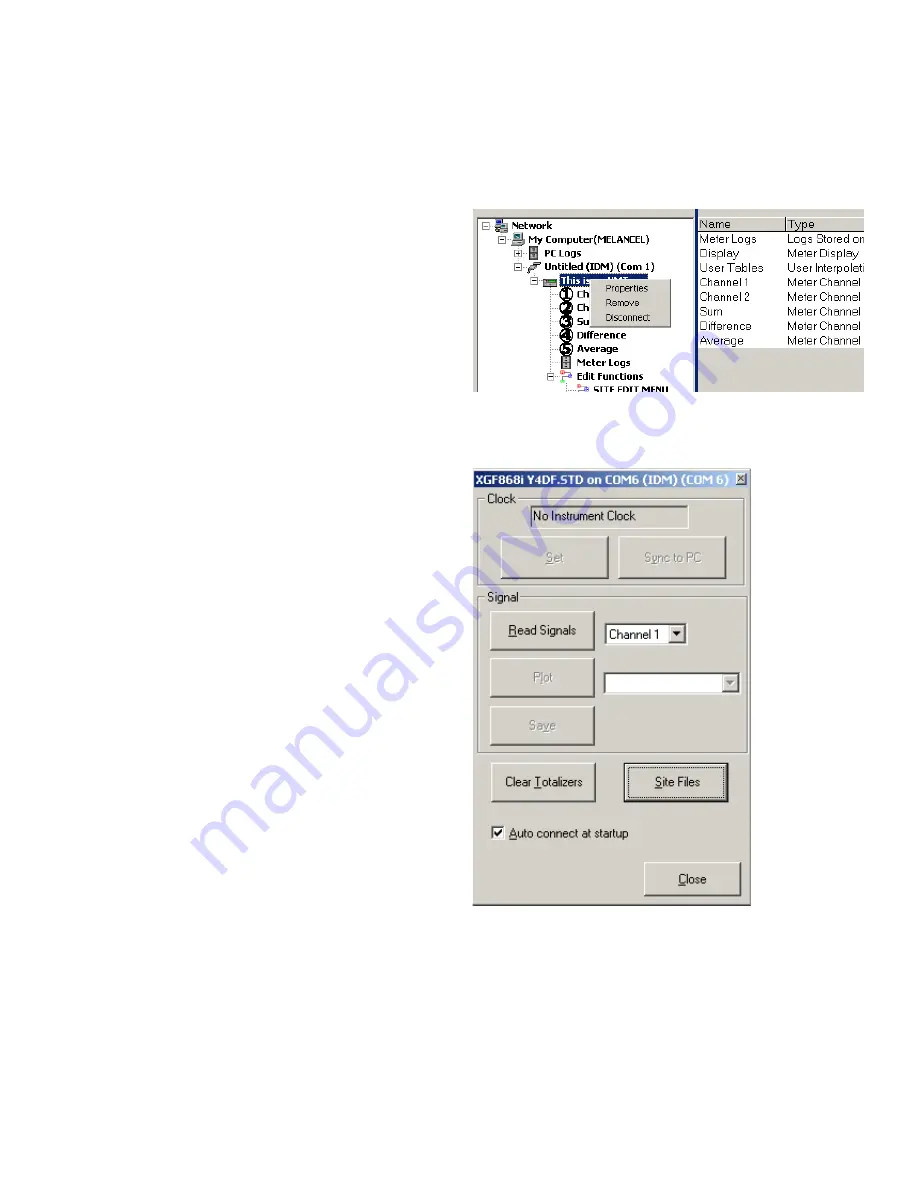
1. From the
new meter browser
, highlight the XGF868i.
2. Right-click on the highlighted XGF868i and click on the
properties
option, as shown in
Figure 5
below.
Figure 5: Properties option in the new meter browser
The
properties
window opens, as shown in
Figure 6
below.
Figure 6: Properties window
26
Содержание DigitalFlow XGF868i
Страница 1: ...DigitalFlow XGF868i Panametrics flare gas flow transmitter Programming manual...
Страница 2: ...ii...
Страница 4: ...no content intended for this page iv...
Страница 10: ...x...
Страница 38: ...28...
Страница 46: ...no content intended for this page 36...
Страница 54: ...44...
Страница 60: ...50...
Страница 88: ...78...
Страница 94: ...84...


