


Chapter 4 Operations for Each Function
4-38
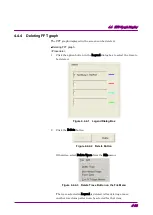
Click the Frequency text box and enter the Frequency value.
When the focus is moved to another control after changing the Frequency
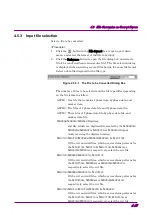
value, the black-line graph cursor in the FFT graph display area is
moved.
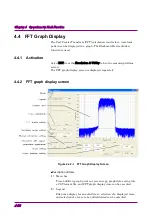
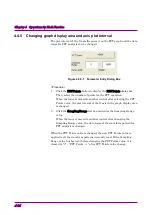
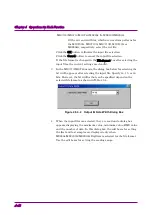
4.4.9 Changing graph scale
The scale of the graph currently displayed can be changed.
■
Changing graph display area scale
The scales for the X and Y axes in the FFT graph display area are
updated by changing the value(s) in the Scale field on the FFT graph
display screen.
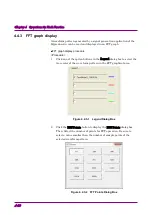
Figure 4.4.9-1 Scale Dialog Box
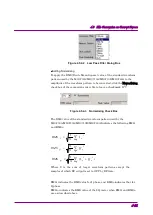
<Procedure>
1. Click the Frequency text box and enter the Frequency value from
the keyboard.
2. Click the Amplitude text box and enter the Amplitude value.
3. When the Full Scale button is clicked, the scales for both axes are
adjusted so that the entire FFT graph is displayed.
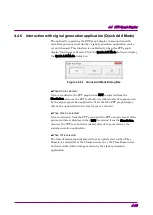
When the focus is moved to another control after changing the value in
the PAR text box as shown in Step 1 above, the scale for the X axis in the
CCDF graph display area is updated.
Similarly, when the focus is moved after changing the value in the
Probability text box as shown in Step 2 above, the scale for the Y axis in
the CCDF graph display area is updated.