


Chapter 4 Operations for Each Function
4-28
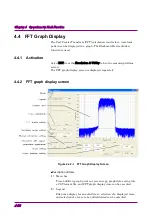
4.4 FFT Graph Display
The Fast Fourier Transform (FFT) calculation results for a waveform
pattern can be displayed in a graph. The Blackman-Harris window
function is used.
4.4.1 Activation
Select FFT from the Simulation & Utility tab on the common platform
screen.
The FFT graph display screen is displayed separately.
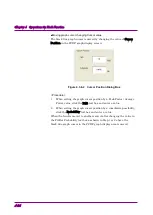
4.4.2 FFT graph display screen
Figure 4.4.2-1 FFT Graph Display Screen
■
Description of items
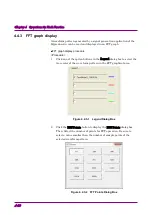
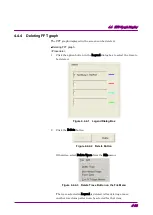
(1) Menu bar
Trace addition, graph print out, screen copy, graph data saving into
a CSV format file, and FFT graph display close can be executed.
(2) Legend
File name display for an added trace, selection of a displayed trace,
and selection of a trace to be added/deleted can be executed.