Wanguard 6.2 User Guide
Reports » Tools
Reports »
Tools
Reports » Tools
contains links to the
Anomalies
,
BGP Operations
,
Firewall Rules
,
Flow Collectors
and
Packet
Tracers
tabs.
Reports » Tools » Anomalies
It provides live and historical data related to DoS, DDoS, and other traffic anomalies.
The number of active traffic anomalies is displayed inside the Reports » Tools panel. This number is
refreshed every 10 seconds. The color of the number reflects the highest severity of the active anomalies.
The Anomalies tab contains 3 sub-tabs located at the lower left side of the window:
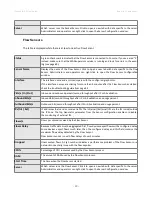
Active Anomalies
It contains a table visible only while Sensors detect traffic anomalies. The rows represent active anomalies,
sorted by start time in descending order. The columns are:
№
The unique index of the anomaly. Click it to open a detailed anomaly report.
Prefix
The IP address/class of the traffic anomaly and its reverse DNS.
In front of the prefix, the arrow indicates the direction of traffic: inbound when the arrow is
pointing towards the prefix, or outbound when the arrow is pointing away from the prefix.
Click it to open a new tab with data specific to that prefix.
IP Group
The IP group of the prefix. Click it to open a new tab with data specific to that IP group.
Anomaly
A short description of the anomaly.
Value (Latest)
The peak value of the abnormal traffic. The latest value is displayed between parentheses.
Sensor
Which Sensor detected the anomaly. Click it to open a new tab with data specific to that Sensor.
From
The time and date when the anomaly started.
Latest Alarm
How much time has passed since the most recent detection of the anomaly.
Pkts/s – Bits/s
The latest packets/second and bits/second throughput of the TOTAL decoder.
Severity
The exact rule severity and link severity are displayed as a tool-tip.
The rule severity field graphically represents the ratio between the abnormal traffic and the
threshold value. Every bar represents 100% of the threshold value.
- 74 -
Содержание wanguard 6.2
Страница 1: ......

