18
8)
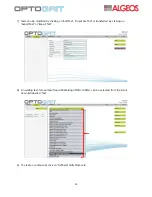
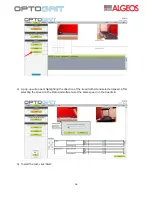
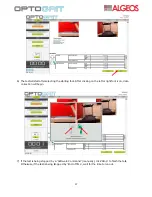
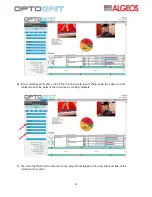
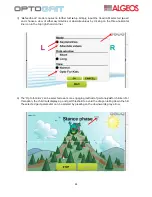
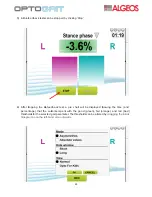
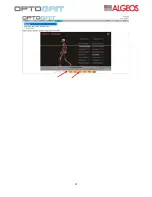
During the test, real-time data (including standard deviations) will be collected within the ‘Gait
Report’ section of the testing screen. This screen will also display video footage from both
cameras and a pie chart demonstrating the time that the patient spent within pre-selected
thresholds for the variable of choice, for example the figure below shows that the patient spent
11% of a 1-minute treadmill gait test in the ‘good’ (green) threshold for Stance Phase.
9)
After the test has finished, click ‘Save’ to save the test data.
Содержание OptoGait
Страница 1: ...OptoGait User Guide Installation and Use...
Страница 10: ...8...
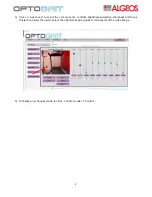
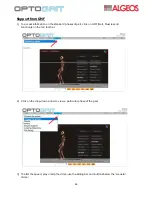
Страница 24: ...22 8 The activation of each lower extremity muscle during gait can be viewed here by using the scroll bars...
Страница 29: ...27...

