


Chapter 7
7-109
Programming Examples
Report Generation Examples
Example 7D: Plotting to a File and Transferring the File Data to a
Plotter
Another report-generation technique is to transfer the plotter string to a disk file, and
retrieve and plot the disk file at another time. Test time is increased when a hardcopy plot
occurs during the measurement process. It may be more convenient to plot the data at
another site or time. One solution to this problem is to capture the plot data using the
controller and store it to a disk file. This disk file may then be read from the controller and
the contents transferred to a plotter. This next example shows a method of accomplishing
this task.
The analyzer is initialized without presetting the analyzer. The data that is in place on the
analyzer is not disturbed by the program operation. A large string is dimensioned to hold
the plotter commands as they are received from the analyzer. The length of this string
depends upon the complexity of the analyzer's display. The analyzer is placed in the
single-sweep mode and
OPC?;SING;
is used to make sure that operation is complete before
plotting. The plotting begins with the
OUTPPLOT;
command.
The string transfer is ended by the controller detecting the EOI line which the analyzer
pulls at the end of the transfer. The string transfer terminates and the plot data is now
stored in a string in the analyzer.
These strings contain ASCII characters which represent the plotter commands in HP-GL
(Hewlett-Packard Graphics Language). A disk file is created and the string is written into
the file containing the display-plot commands.
Once the strings are transferred to the disk file, the file pointer is rewound and the data is
read out into a string for plotting. The string is sent to the plotter which uses the
commands to generate a plot.
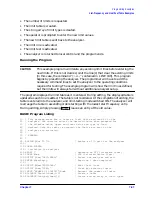
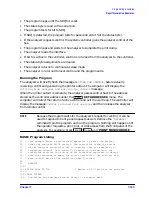
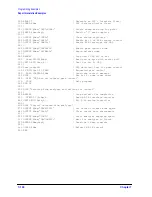
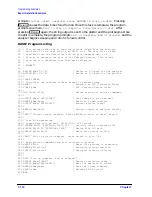
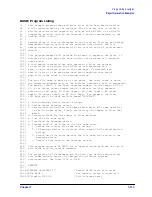
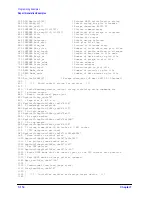
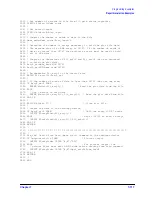
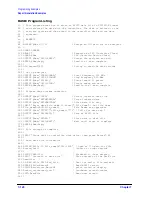
The following is an outline of the program's processing sequence:
• An I/O path is assigned for the analyzer.
• An I/O path is assigned for the plotter.
• The system is initialized.
• The string for plotter commands is defined.
• The frequency span is swept once.
• The plotter output is requested and read into the plot string.
• A plot file is created in the controller.
• The plot string is stored into the disk file.
• The plot string is read from the disk file and sent to the plotter.
• The analyzer returns to continuous-sweep mode.
• The analyzer is returned to local control and the program ends.
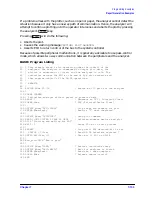
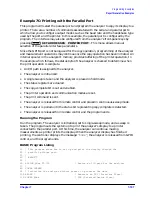
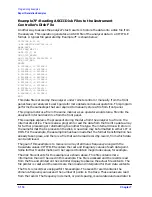
Running the Program
The program begins by initializing the analyzer and placing it into single-sweep mode. The
plotter commands are captured into strings in the controller. The controller display
Содержание 8719ES
Страница 15: ...1 1 1 Alphabetical Command Reference ...
Страница 293: ...2 1 2 Introduction to Instrument Control ...
Страница 310: ...3 1 3 GPIB Programming ...
Страница 334: ...4 1 4 Reading Analyzer Data ...
Страница 343: ...5 1 5 Data Processing Chain ...
Страница 350: ...6 1 6 Error Reporting ...
Страница 364: ...7 1 7 Programming Examples ...
Страница 502: ...A 1 A Preset Conditions ...
Страница 517: ...B 1 B Command Listings ...


