Spectrometer
Copyright 3B ©2011
24
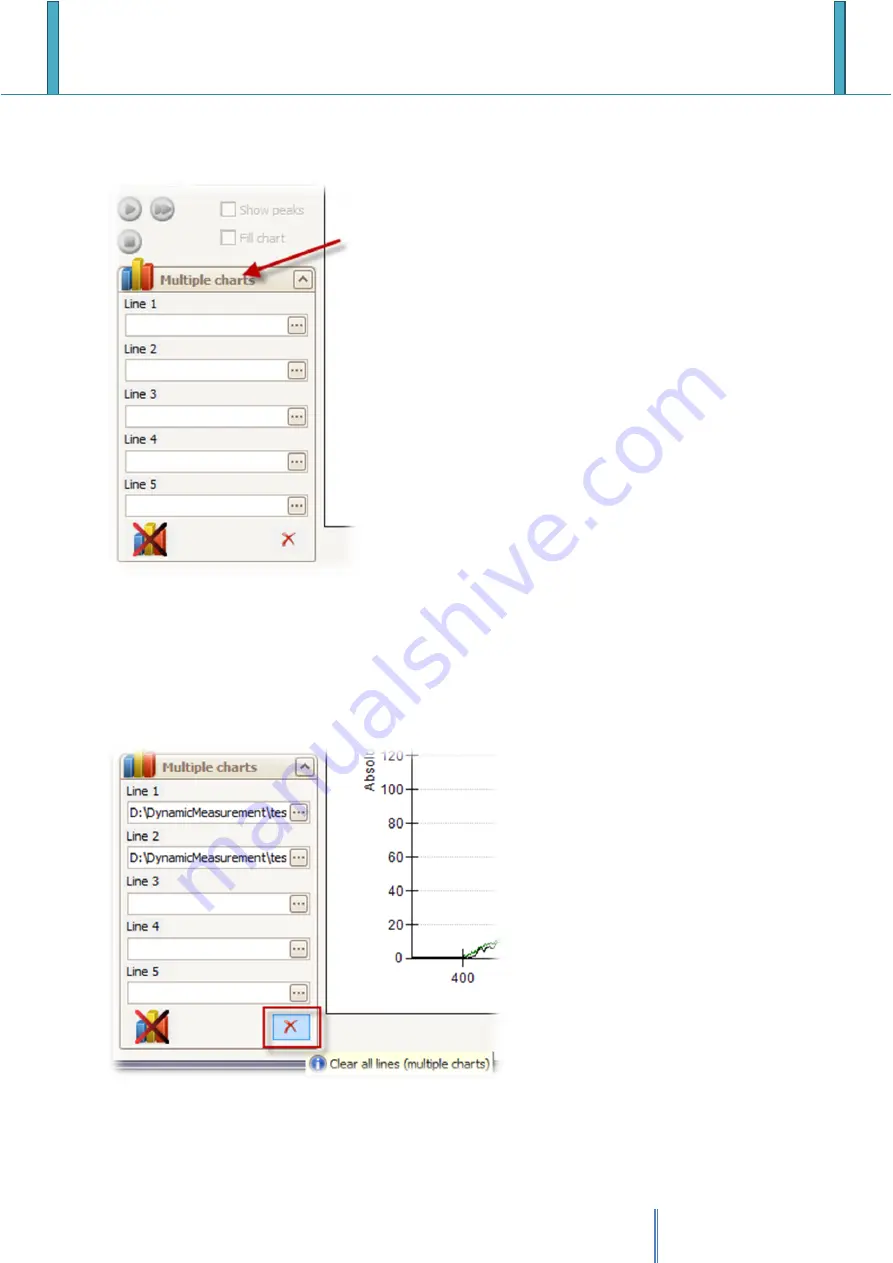
Multiple charts
After stopping the dynamic measurement up to five spectra can be specified for review in the
‘Multiple charts’ tab.
The spectrum image used in ‘Line 1’ will be used also for the preview (to be able to specify the range
for spectrum calculation) and spectrum calculation area.
During multiple charts mode, some chart features (show peaks, fill chart …) are disabled.
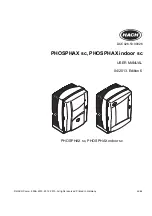
To clear multiple charts tab, press the ‘Clear all lines (multiple charts)’ button


