Saluki DSO1000, User Manual
The Saluki DSO1000 is a cutting-edge electronic device designed for accurate measurement and analysis. Enhance your user experience with the comprehensive user manual provided in a downloadable, free format. Unlock the full potential of your Saluki DSO1000 by visiting manualshive.com to gain access to this essential manual.
Share
Download


Reviews:
No comments
Related manuals for DSO1000

FIO-01
Brand: ABB Pages: 14
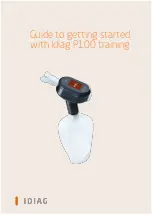
P100
Brand: idiag Pages: 10

2290
Brand: Bandit Pages: 136
Versaflo S Series
Brand: 3M Pages: 11
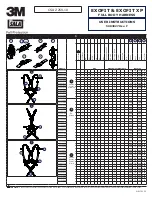
DBI Sala EXOFIT
Brand: 3M Pages: 32

746
Brand: 3M Pages: 8

WS Series
Brand: Accurate Bio-Medical Technology Pages: 35

Orbit
Brand: RASHA PROFESSIONAL Pages: 11

LUNA
Brand: MADRIX Pages: 24

LUNA
Brand: MADRIX Pages: 28

CR7
Brand: Raven Pages: 17

SC932A
Brand: Campbell Pages: 12

204
Brand: Hagie Pages: 141

GLVE 1400-34
Brand: Gardol Pages: 260

60091
Brand: York Fitness Pages: 20

5126
Brand: H&S Pages: 42

NXP-HTU
Brand: Jackson Pages: 2
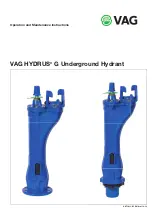
HYDRUS G
Brand: Vag Pages: 10


