Lauterbach C6000, Manual
The Huawei C6000 User Manual is a comprehensive guide that provides step-by-step instructions and helpful tips to maximize the functionality of your device. Easily downloadable and completely free, visit manualshive.com to access the manual and unlock the full potential of your Huawei C6000.
Share
Download


Reviews:
No comments
Related manuals for C6000
77
Brand: IBM Pages: 12

BLUETOOTH KEYBOARD
Brand: Targus Pages: 7
2135
Brand: Safco Pages: 6

ClickShare
Brand: Barco Pages: 7
Action Replay DSi
Brand: Datel Pages: 2
Z3 Series
Brand: ZALMAN Pages: 20
EZ Link DAL 150
Brand: Harman Kardon Pages: 16

Wormhole Station JUH-320
Brand: J5create Pages: 24
FireWire 1814
Brand: M-Audio Pages: 61
iPazzPort
Brand: Unisen Pages: 9
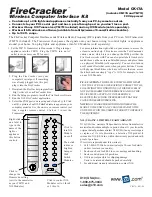
FireCracker CK17A
Brand: X10 Pages: 1
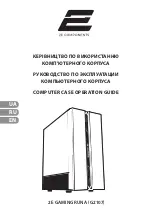
RUNA
Brand: 2E GAMING Pages: 26

NSK 4000
Brand: Antec Pages: 5
EYES 7
Brand: Pout Pages: 5
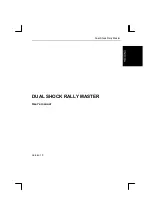
Dual Shock Rally Master
Brand: Trust Pages: 9
CSAZ-3000
Brand: AZZA Pages: 18
KeyFolio Pro
Brand: Kensington Pages: 82

MEDIA WIRELESS DESKTOP 800 -
Brand: LABTEC Pages: 12


