JEOL JSPM-5200, Instructions Manual
The JEOL JSPM-5200 product comes with a comprehensive Instructions Manual for easy setup and operation. You can download the manual for free from manualshive.com, ensuring that you have all the necessary information to maximize the performance of your JEOL JSPM-5200.
Share
Download


Reviews:
No comments
Related manuals for JSPM-5200
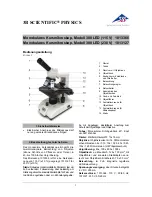
300 LED 1013366
Brand: 3B SCIENTIFIC PHYSICS Pages: 12

M8311E Series
Brand: Omax Pages: 11

IX81-ZDC2
Brand: Olympus Pages: 16

IX81
Brand: Olympus Pages: 68

88-55001
Brand: Bresser Pages: 60

3050 Series
Brand: Accu-Scope Pages: 4

3000-LED series
Brand: Accu-Scope Pages: 20

SM-4 Series
Brand: AmScope Pages: 37

490 Series
Brand: AmScope Pages: 64

SMZ-1B
Brand: Nikon Pages: 3

M51B
Brand: Omax Pages: 6

MIC-D
Brand: Olympus Pages: 28

Vision V5000
Brand: Woodley Pages: 44

qc3247
Brand: DigiTech Pages: 32

Visio-tel
Brand: Visio-Tek Pages: 12

B-380 Series
Brand: Optika Pages: 62


