background image

S e n s i n g   y o u r

data logging needs

including

Multi

Lab


Imagi

Probe


User Guide

S e n s i n g   y o u r

data logging needs

© 2003 Fourier Systems Ltd. All right reserved. Fourier Systems Ltd. logos and all other Fourier product or service names are registered trademarks or
trademarks of Fourier Systems. All other registered trademarks or trademarks belong to their respective companies. Doc. BK043, Rev. 05/03

w w w. f o u r i e r- s y s . c o m
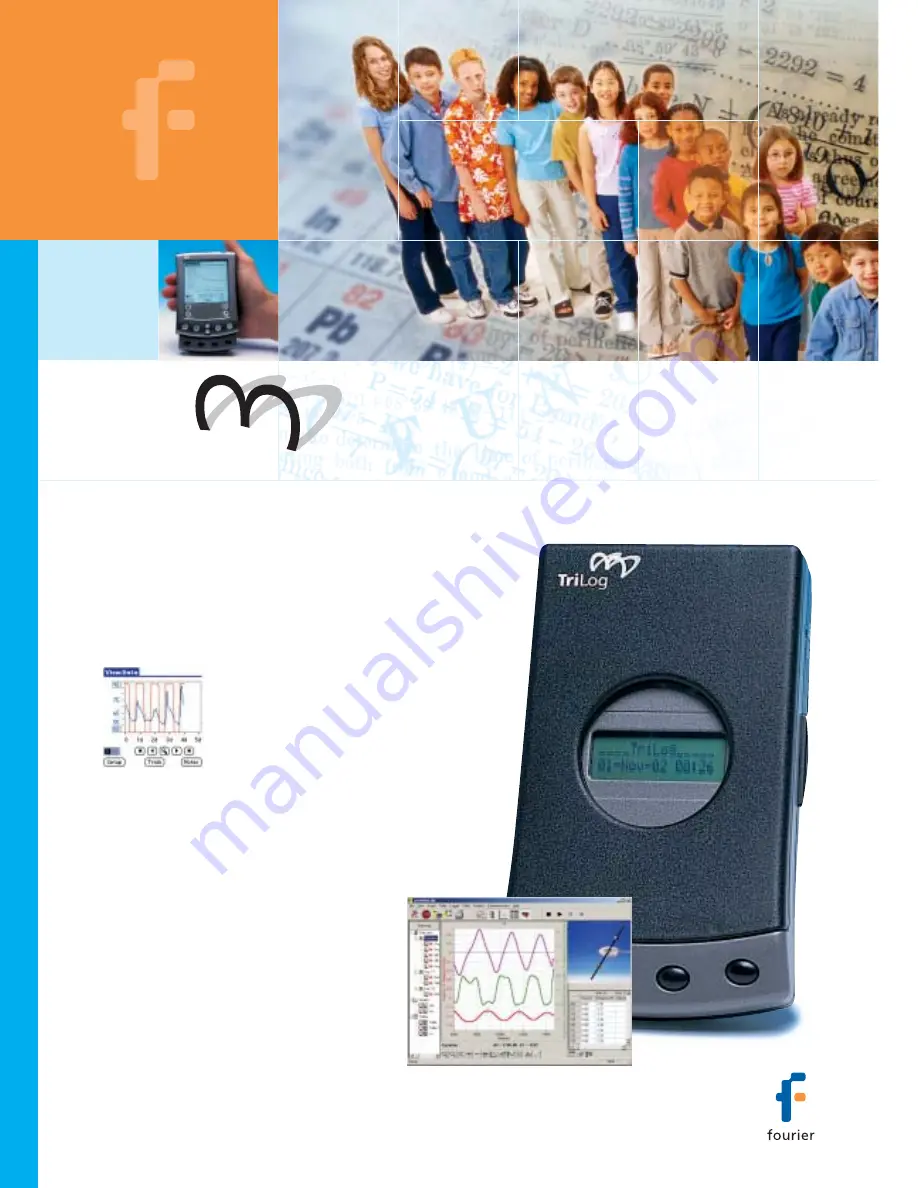
Tri

Log

og

Triple-platform data logger: stand-alone, slot
on to Palm

, or even connected to the PC

and MAC

Summary of Contents for ImagiProbe

Page 1: ...Sensing your data logging needs including MultiLab ImagiProbe User Guide ds TriLog og Triple platform data logger stand alone slot on to Palm or even connected to the PC and MAC...

Page 2: ...TriLog User Guide Fourier Systems First Edition First print Printed in July 2003...

Page 3: ...Temperature Compensation 19 1 3 4 MultiLab Sensor Calibration 19 1 3 5 Factory Calibration No calibration required 19 Chapter 2 Working with Palm Handheld and ImagiProbe 20 2 1 Install the Software 2...

Page 4: ...red Devices 39 1 Installing Content Databases by Beaming 39 2 Installing Content Databases Using HotSync 40 2 6 3 Merging Content Databases into ImagiProbe 3 0 40 2 6 4 Deleting Content Databases befo...

Page 5: ...s 63 3 4 5 Data Map 64 1 Control the display with the Data Map 64 2 Understanding Data Map icons 64 3 4 6 Export Data to Excel 65 Export file settings 65 3 4 7 Copy the Graph as a Picture 65 3 5 Progr...

Page 6: ...calculations 93 5 Tips on using the Timing Wizard 96 3 8 3 Crop Tool 97 1 To trim all data up to a point 97 2 To trim all data outside a selected range 97 3 8 4 Capture Tool 97 1 Preparing the captur...

Page 7: ...VII Index 115...

Page 8: ...sensor based science laboratory that enables students to collect and visually analyze data The TriLog system also comes with the powerful MultiLab software When the TriLog is connected to a PC live d...

Page 9: ...to set up TriLog How to connect TriLog to your PC 1 1 General 1 1 1 TriLog system contents Figure 1 Contents of the TriLog system 1 The TriLog Data Logger 2 Sensors see your package list 3 Four senso...

Page 10: ...ly When a splitter cable is connected it must be connected to the socket in the correct numerical order e g for 5 sensors connect the splitter cable to In 4 5 One of the two splitter cables is marked...

Page 11: ...ta will be lost Note Battery shelf charge life is about 100 hours To maximize battery shelf charge life always disconnect sensors when not in use Disconnect TriLog from the computer when not in use Yo...

Page 12: ...his mode when turned on for the first time When using more than 4 sensors when using VERNIER sensors or if you ve defined your own sensor switch to the 8 sensors mode You can select the working mode e...

Page 13: ...IER sensors 1 2 3 Quick Start Before you first use TriLog charge the unit for 10 to 12 hours while it is turned off 1 Turn on TriLog Press the On button for one second You will see the initialization...

Page 14: ...g the RUN button a second time Otherwise logging will stop after the selected number of samples where taken The LCD screen will display the number of the experiment in TriLog s memory _ _ _ LOGGER RUN...

Page 15: ...utomatically updated to the PC s time and date each time you connect your TriLog to a PC The internal clock and calendar is kept updated even when the TriLog is turned off but it will be erased if the...

Page 16: ...rt an experiment using manual data logging set the RATE to manual and press the Run button once to start the data recording then press the Samples button each time you want to collect a sample 2 Sampl...

Page 17: ...ents of 32 000 samples each When sampling at rates of 100 samples per second or less selecting Maximum sampling points will create up to four successive files of 42 500 points each a total of 170 000...

Page 18: ...screw until the sensor shows the correct measured value obtain the actual correct value from another source that is known to be accurate 1 3 2 TriLog Automatic Zero Calibration TriLog is able to auto...

Page 19: ...can also be calibrated using the Calibrate Sensors option in MultiLab s Logger menu Please refer to section 3 5 6 for more on this 1 3 5 Factory Calibration No calibration required All digital sensor...

Page 20: ...memory Palm OS 3 5 or later 2 1 2 Installation 1 Follow the instructions in the Palm handheld manual to install the Palm Desktop software onto your desktop computer 2 Open the ImagiProbe 3 0 Installe...

Page 21: ...e trying to answer with evidence derived from a series of independent data collection trials The ImagiProbe application enables you to add investigations and trials limited in size and number only by...

Page 22: ...es you can use the gesture recognition capability called Graffiti built into Palm OS you can access an on screen keyboard or you can attach on optional keyboard 2 2 2 Palm Panel Layout Future chapters...

Page 23: ...held at an angle to the front of the interface slide the connector at the base of the Palm handheld onto the matching connector at the bottom of TriLog 3 Simultaneously depress release buttons on both...

Page 24: ...nge the investigation s default name by tapping on the name and changing it in the New Name dialog box If you are not sure how to enter text refer to your Palm Powered computer s manual 3 Tap OK to ma...

Page 25: ...Sampling Rate dialog 3 Pick the number of samples per time unit from the Samples time unit pick list 4 Tap OK Note The maximum sampling rate depends on the time unit and the number of sensors connect...

Page 26: ...y axis scale for one sensor from the Preview Data or View Collected Data forms 1 Tap the Scale Picker and tap Scale Y to open the Rescale Y Axis entry form 2 Enter new values for From and To 3 Tap OK...

Page 27: ...lecting working mode Before you can assign sensors for a trial you must first setup the application to expect manual or automatic sensor assignment For manual setup ensure that the Auto ID function is...

Page 28: ...data with multiple sensors simultaneously 2 4 4 Viewing Collected Data When you have completed a data collection trial the ImagiProbe application returns you to the Data form In the Data form you can...

Page 29: ...en select Zoom X 2 4 5 Adding and Editing Notes The ImagiProbe application provides Notes forms that enable you to add and edit pages of notes to investigations trials sensors and calibrations You can...

Page 30: ...ur notes are automatically saved 2 Editing a text note with the on screen keyboard To edit text in a note with the on screen keyboard from a Notes form 1 Tap the Alpha Keyboard Target to display the o...

Page 31: ...use it for example to setup data collection parameters for trials in advance of your investigation To save a trial setup leave the Edit Trial Setup form by tapping the Save button before tapping Colle...

Page 32: ...tigation 5 Tap OK when prompted 2 Deleting Trials To delete a trial and its notes from the Trial form 1 Tap the Menu icon on your handheld computer to display the ImagiProbe application menus 2 Select...

Page 33: ...cess 2 5 1 Accessing the Sensor Module To access the Sensor module from the Investigations form 1 Tap the Menu icon or press the Menu key on your handheld computer to display the ImagiProbe applicatio...

Page 34: ...Sensor list 1 Tap New Sensor 2 Select Linear from the Choose Sensor Type dialog and tap OK 3 Enter a name for the sensor 4 Enter a manufacturer for the sensor See Adding Calibrations to calibrate thi...

Page 35: ...To calibrate a sensor by reference from the View Sensor form 1 Tap New Calibration 2 Specify an operating range Min to Max for the sensor by entering its minimum and maximum values 3 Specify units fo...

Page 36: ...ys consult the documentation provided with your sensor to find the background information necessary to calculate the proper calibration constants for your non linear sensor 1 Calibrating a Non Linear...

Page 37: ...talling Sensor Databases on Palm Powered Devices 1 Installing Sensor Databases Using HotSync Installing sensor databases using the HotSync method requires three steps a download the desired sensor dat...

Page 38: ...device If you do not install the sensor database it will remain on the Palm device and the ImagiProbe application will prompt you to merge the database each time you open it Delete the sensor databas...

Page 39: ...o create investigations and trials complete with notes After you have created a collection of investigations and trials that represent the content you wish to cover save it as a database that you can...

Page 40: ...ontent databases stored on a desktop computer 1 Locate the content database you wish to install e g database1 pdb 2 Double click on that file name to open the Install Handheld Files Window of the HotS...

Page 41: ...ugh it using your favorite browser you can import it into MultiLab or into any other application that accepts tab delimited text data e g AppleWorks Excel Before you can copy data from your handheld c...

Page 42: ...lso the ImagiProbe conduit will by default report samples in elapsed time instead of according to time of day You may wish to change these default settings To turn off HotSync for the ImagiProbe syste...

Page 43: ...ons or slower sampling rates To turn off HotSync from the ImagiProbe system click on the Hot Sync manager icon which is on the task bar in the lower right corner of the screen 1 Choose Custom from the...

Page 44: ...tigation folder contains sub folders for each trial within that investigation These trial sub folders contain a tab delimited text file named trialname_Data txt for each trial s data Open these text f...

Page 45: ...Figure 9 ImagiProbe Trial Page 5 Click on the top data link to review the data collected in the trial as an HTML table The first column of data in the table will display either the time elapsed since...

Page 46: ...le named trialname_Data txt for each trial s data Open these text files in MultiLab for further analysis To import a trial data file 1 Open MultiLab 2 Click File on the menu bar then click Import Palm...

Page 47: ...and play voice comments your system should be equipped with a sound card a microphone and a speaker 3 1 2 Installation Insert the CD into your CD drive Installation will begin automatically Simply fo...

Page 48: ...elect Specify the location of the driver then click Next 4 Select Search for the best driver for your device then check the Removable Media checkbox and then click Next Windows will automatically dete...

Page 49: ...s are displayed on three toolbars Tools that relate to all aspects of the program and tools that control the TriLog are located in the main upper toolbar Tools specific to the graphs are located on th...

Page 50: ...ct and process for a given experiment is stored in a single project file Each of these files contain all the data sets you collect with the TriLog the analysis functions you ve processed the video fil...

Page 51: ...lick Run on the toolbar to start recording If the recording rate is 100 measurements per second or less MultiLab automatically opens a graph window displaying the data in real time plotting it on the...

Page 52: ...th the data graph You can also add voice comments to the video recordings To work with the video window your system should be equipped with a video camera To be able to record and play voice comments...

Page 53: ...the Video only option If you plan to record voice comments only select the Audio only option 3 3 4 Download Data Whenever data is received from the TriLog it is accumulated and displayed automatically...

Page 54: ...n the Download dialog box Click Cancel in the Download progress window at any time to stop downloading the data 3 3 5 Save Data Click Save on the main toolbar to save your project This will save all t...

Page 55: ...k Import CSV file 2 In the dialog that opens next to Look in navigate to the drive and folder that contains the CSV file 3 Select the file 4 Click Open Tips To create a text file in a spreadsheet 1 Op...

Page 56: ...toolbar 2 Select the Graph 1 option when in split graph mode you can choose between Graph 1 and Graph 2 3 Click Print to open the print dialog box 4 Click OK MultiLab will print exactly what you see i...

Page 57: ...he window display type you want 4 Click OK In addition to these sections you have the option to display an on screen meter for each of the sensors see page 63 3 4 2 Graph Display Click Graph to displa...

Page 58: ...Cursor on the graph toolbar You can drag the cursor with the mouse onto any other point on the plot or onto a different plot For finer cursor movements use the forward and backward keys on the keyboa...

Page 59: ...ific area Click Zoom to selection on the graph toolbar and drag the cursor diagonally to select the area you want to magnify Release the mouse button to zoom in to the selected area Click Zoom to sele...

Page 60: ...g the mouse to view another area Click Pan a second time to disable the Pan tool 5 Edit the Graph Use the Edit graph dialog box to select which data sets to display on the graph s Y axis and to change...

Page 61: ...lor style and width as well as the markers color and style To remove the line or the marker uncheck the corresponding Visible check box 4 Click OK 5 To restore the default formatting click Restore def...

Page 62: ...original data unchanged To do this 1 Select a data cell by clicking on it 2 Type in the new value 3 Press Enter on the keyboard to accept you can also press Tab or the arrow keys to accept and move t...

Page 63: ...fic check box 6 Click OK 4 Add a table to the project MultiLab displays new data in the table window every time you start a new recording You can always display previously recorded data using the Edit...

Page 64: ...the list You can also use the plus and minus signs next to the icons to expand or collapse the categories The Data sets list expands to sub categories of experiments and functions To display the comp...

Page 65: ...yed on graph 1 Graph currently displayed on graph 2 Graph currently displayed both on graphs 1 and 2 List of saved tables Saved table Table not currently displayed Table currently displayed 3 4 6 Expo...

Page 66: ...setup wizard Figure 16 Setup wizard step 1 of 3 The first step is to assign sensors to each input If you are working with TriLog in Auto ID mode the sensors are selected automatically as you plug them...

Page 67: ...ng samples Recording period Recording rate 8 To start the data recording only when a specific time or measurement condition has been met click Triggering to open the triggering dialog box see page 69...

Page 68: ...on You can define the settings of each sensor input individually in the first step of the Setup wizard 1 Click Setup Wizard on the main toolbar to open the setup wizard 2 Click Properties next to the...

Page 69: ...OK 5 Power saving mode To enable TriLog s power saving mode see on page 11 check the Power saving mode check box in step 2 of the Setup wizard Note the Power saving mode check box is enabled only aft...

Page 70: ...orded data from the sensor falls above or below a pre defined threshold for example a fan that will start operating when the temperature measured by the sensor rises above 30 C This function requires...

Page 71: ...rate any of the sensors manually This calibration is much more accurate than the calibration performed by TriLog With MultiLab you can calibrate the sensor using two points instead of the one point au...

Page 72: ...e sampled phenomenon changes must be a linear Transfer Function 3 The sensor must have a code resistor in order to be automatically identified If the sensor does not have a code resistor you will have...

Page 73: ...tiLab software MultiLab will automatically attempt to communicate with the data logger If communication is achieved the selected port becomes designated as TriLog s communication port If communication...

Page 74: ...with the Analysis Tools The analysis tools can only be applied to data sets that are displayed in the graph window 1 Use the cursors see page 58 to select the graph and the data range to which you wan...

Page 75: ...which you want to apply the statistics 2 Click Analysis on the menu bar then click Statistics MultiLab will open a statistics window and will display the results in it 3 6 6 Most Common Analysis Funct...

Page 76: ...u would like to apply the analysis 2 Click Analysis Wizard on the main toolbar 3 Click a category tab a Curve fit b Averaging c Functions 2 Curve fit Figure 23 Analysis wizard curve fit 1 Select a fit...

Page 77: ...page 89 3 Averaging Figure 24 Analysis wizard averaging 1 If you use the cursor to select a data set it will be highlighted in the Based on data set list but you have the option of selecting a differ...

Page 78: ...on involves two data sets select the second data set from the G2 drop list 4 Enter a constant in each of the C1 and C2 boxes optional 5 Enter a name in the Name box optional the default name includes...

Page 79: ...dium averaging 11 n High averaging 41 n 3 Functions In the formulas below G1 and G2 represent selected data sets and C1 and C2 are constants that you can enter The constant s default value is 1 Absolu...

Page 80: ...a data set For high recording rates and small t this line may be very noisy which is why smoothing the data set is recommended before applying the derivative function Divide 2 2 1 1 G C G C y Draws a...

Page 81: ...rete integral of all the preceding points in a data set Kinetic energy 2 1 1 2 1 G C y Draws a line of the kinetic energy of a data set The argument 1 G must be the velocity of the body and the consta...

Page 82: ...n tan 1 2 1 G C C y Draws a line of the tangent values of a data set The argument 1 2G C must be expressed in radians 3 6 9 Online Analysis MultiLab enables you to analyze data from a live experiment...

Page 83: ...t 4 Click OK 5 Click Edit graph on the graph toolbar to open the Graph edit dialog box Figure 27 Using graph edit dialog to display online functions 6 In the Y Axis list click Input 1 Angle to select...

Page 84: ...subsequent recordings To remove the online functions click Analysis on the menu bar and then click Clear online functions 3 6 10 Manual Curve Fitting The manual curve fit tool enables you to draw a m...

Page 85: ...the Y axis list 4 Click OK MultiLab will display the Manual curve fit toolbox at the bottom of the graph window Figure 29 Manual curve fit toolbox 5 Choose one of the four curves by clicking the icon...

Page 86: ...roject file with the same predefined setup You can use Fourier produced worksheets or create your own You can also modify Fourier s existing worksheets to your own specifications 3 7 2 Opening a Works...

Page 87: ...h format desired special preset graph scaling sensors measurement etc 1 Create an HTML document with Word 1 Create a new Web page 1 Open Word 2 In the File menu click New 3 Do one of the following On...

Page 88: ...re 31 Creating a worksheet 4 Click Enter experiment settings to open the Setup wizard 5 Use the setup wizard to preset MultiLab and TriLog just as with the normal setup process see page 66 6 When you...

Page 89: ...8 2 The Timing Wizard 1 Overview The Timing Wizard enables you to easily measure and calculate many types of time events including velocity and acceleration with one or two photogates Connect one phot...

Page 90: ...ody s width or the distance between the gates in cm in the appropriate edit box in velocity and acceleration measurements only 7 Click Finish to display the results 8 If you want to change the method...

Page 91: ...es the body to move from one photogate to the second photogate between blocking the first and blocking the second infrared beams Pendulum Measures the time period of an oscillating body the time inter...

Page 92: ...velocities You should enter the bodies width the width of the two bodies must be identical Acceleration At one gate A card with two flags must be attached to the moving body see figure to the left The...

Page 93: ...ng with MultiLab 93 4 Time schemes and calculations 1 Time measurements At one gate Result 1 2 t t t Between gates Result 1 3 t t t Pendulum one gate Result 1 5 t t t t5 t3 t1 t2 t4 t2 t1 t1 t2 t3 t4...

Page 94: ...arameters w the body s width Result 1 2 t t t t w v Between gates Required parameters L the distance between gates Result 1 3 t t t t L v Collision two gates Required parameters w the bodies width mus...

Page 95: ...esult 7 8 2 5 6 2 3 4 1 1 2 1 t t w v t t w u t t w v t t w u 3 Acceleration At one gate Required parameters w the flags width Result t v v a t t t t t t t w v t t w v 1 2 1 2 3 4 3 4 2 1 2 1 2 t5 t7...

Page 96: ...ng body When measuring the motion of a moving cart it is convenient to attach a vertical flag to the cart see picture below You can mount a slotted wooden block on the cart and insert the flag onto th...

Page 97: ...ime scale of the trimmed data is shifted so that it will start at 0 t If you want the automatic curve fit equation to start at 0 t apply the crop tool before any type of curve fitting After applying t...

Page 98: ...on the menu toolbar and then click Capture mode to open the Capture dialog box Figure 34 Capture dialog box 2 In the Available Sensors list select the sensors you want to capture by clicking their nam...

Page 99: ...ltiLab enters the momentary data to the capture table sequentially 3 If logging stops simply click Run to continue the data recording and capturing 4 After you ve finished capturing the desired data c...

Page 100: ...Lab 2 Choose the data set that you wish to display on the X axis from the X Axis list by clicking its name 3 Choose the data set or sets you wish to display on the Y axis from the Y Axis list by click...

Page 101: ...Download Download the data from the most recent recording session Setup Open the Setup dialog box Meter setup Open the Meter setup dialog box Data map Display the Data Map Graph Display the graph wind...

Page 102: ...ile in zoom mode More smoothing Smooth average the selected curve Less smoothing Reverse the most recent smoothing operation 1st Cursor Display or remove the first cursor 2nd Cursor Display or remove...

Page 103: ...rediction onto the graph Erase prediction Erase the selected prediction 3 9 3 Table Toolbar Edit table Add remove columns from the table Table properties Format fonts and units Add to project Add the...

Page 104: ...that the experiment began and ended in less than a second If this is not the reason recharge the 2 4V battery and try again TriLog monitors the battery power during the logging If the battery voltage...

Page 105: ...cover and using a paper clip press the reset button see instructions and figure on page 23 4 1 2 Troubleshooting the ImagiProbe Application Symptom Cause of problem Can t find the ImagiProbe applicat...

Page 106: ...Settings for the ImagiProbe Conduit Make sure the ImagiProbe Conduit is not set to Do nothing Double click on the ImagiProbe installer to reinstall the ImagiProbe conduit A blank graphic icon appears...

Page 107: ...The communication cable is not connected properly The communication cable is not connected to the correct PC COM Port There is no available COM Port I downloaded unexpected data There may be up to 10...

Page 108: ...pter 4 Troubleshooting Symptom Cause of problem I can t record voice comments The microphone volume is muted Open Window s volume control and uncheck the Mute check box at the bottom of the Mic volume...

Page 109: ...e 200 kHz Resolution 12 bit 4096 Levels Man machine interface Full keypad operation enabling manual programming of TriLog Alfa Numeric LCD 2 lines by 16 characters each Features Stand alone operation...

Page 110: ...etic Field 10mT 0 2mT DT028 Microphone DT008 Oxygen DT222A PH DT016 Photo Gate DT137 Pressure 0 to 10 kPa DT015 2 Pressure 0 to 700 kPa DT015 1 Pressure Mat DT033 Rain collector AC013 Rotary Motion DT...

Page 111: ...diting notes Zooming and paging through data Calibration of the TriLog sensors Capability of interfacing with sensors from other vendors Adding content databases Installing content databases by beamin...

Page 112: ...Log setup programming Calibration of the TriLog sensors Capability of interfacing with sensors from other vendors System requirements 1 Software Windows 95 or later Windows 95 and Windows NT will not...

Page 113: ...step 2 of 3 66 Figure 18 Setup wizard step 3 of 3 67 Figure 19 X axis properties dialog box 69 Figure 20 Triggering dialog box 69 Figure 21 Define new sensor dialog box 72 Figure 22 Communication set...

Page 114: ...define a custom sensor in the MultiLab program you must choose one sensor from the list provided Note its position in the list and look in Table 1 to find the resistance Table 1 Auto recognition resis...

Page 115: ...ve 75 display control the display 64 data map 64 graph 57 meters 63 options 57 properties 68 table 62 video 52 download 53 54 E edit data values 62 graph 60 notes 30 table 62 trial setup 31 erase 31 e...

Page 116: ...stom 34 72 measurement 67 plug in 13 properties 67 setup 15 24 66 load the last 15 slope See derivative smoothing 74 socket configuration 114 specification 109 spreadsheet 46 65 stand alone 12 start 1...

Reviews: