Casio E-Con EA-200, User Manual
The Casio E-Con EA-200 Technical Reference manual is essential for anyone seeking comprehensive information on this cutting-edge product. Packed with detailed instructions and diagrams, this free manual provides a valuable resource for troubleshooting and maximizing the potential of your Casio E-Con EA-200. Download yours at manualshive.com.
Share
Download


Reviews:
No comments
Related manuals for E-Con EA-200

EN-106
Brand: Promax Pages: 34

CP1013D II
Brand: Canon Pages: 28

CHECKBOOK III P.12
Brand: Canon Pages: 20
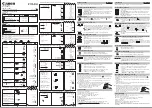
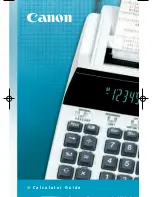
12-Digit Fluorescent
Brand: Canon Pages: 2
12-Digit Fluorescent
Brand: Canon Pages: 66

DK-100i
Brand: Canon Pages: 42

F-10
Brand: Canon Pages: 16

CP1250-D
Brand: Canon Pages: 4

CP1200D - Commercial Desktop Printer
Brand: Canon Pages: 4

161
Brand: Canon Pages: 27

AS-120R
Brand: Canon Pages: 2

Canola SX-300 series
Brand: Canon Pages: 116

CP1260D
Brand: Canon Pages: 2

SCDM-HD1
Brand: Logenex Pages: 10

WT-ISDB-2ME
Brand: Wire Tech Pages: 35

15-2526
Brand: Radio Shack Pages: 10

UFM 341
Brand: Kathrein Pages: 16

ELSIMATE EL-330T
Brand: Sharp Pages: 2


