background image

Your In-Home Display 


Overview  

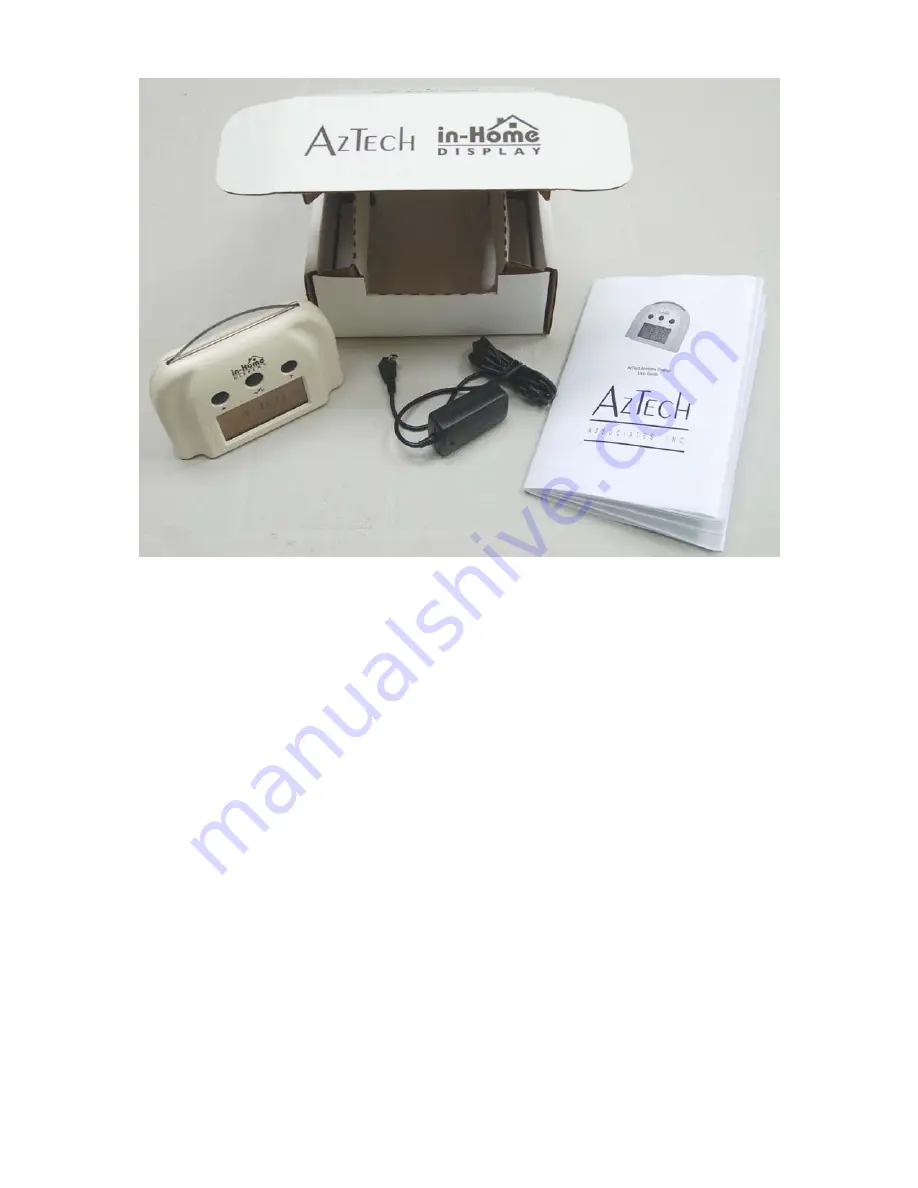
The In-Home Display by Aztech Associates Inc. is a user-friendly product for monitoring energy consumption and its associated cost 
within the home. It communicates wirelessly to the smart electricity meter installed on your home to present electricity used, its 
estimated cost, and historical energy consumption. This guide explains how to use the In-Home Display and outlines what 
information can be displayed.  
The In-Home Display is lightweight and compact and is supplied with a power supply, so that you can place it in a convenient and 
easy-to-view location. The color of the Light Bar (green, yellow, or red) is used to display different electricity rates at a glance and 
the “speed” of its motion is proportional to the amount of energy you are consuming. The LCD display clearly shows numerical and 
graphical information with the option to adjust backlight intensity for better visibility. 
 
This manual reflects all the features available in the Aztech In-Home Display, your display may not have all the features shown. 


Although efforts have been made to provide accurate electricity cost information, 

all electricity cost data displayed by the In-Home 

Display is estimated for informational and educational purposes only and not for billing

FCC Warning 

This equipment has been tested and found to comply with the limits for a Class B digital device, pursuant to Part 15 of the FCC Rules. These limits are 
designed to provide reasonable protection against harmful interference in a residential installation. This equipment uses and generates radio frequency 
energy and, if not installed and used in accordance with the instructions, may cause harmful interference to radio communications. However, there is no 
guarantee that interference will not occur in a particular installation. If this equipment does cause harmful interference to radio or television reception, 
which can be determined by turning the equipment off and on, the user is encouraged to try and correct the interference by one or more of the following 
measures: 
• Reorient or relocate the receiving antenna. 
• Increase the separation between the equipment and receiver. 
• Connect the equipment into an outlet on a circuit different from that to which the receiver is connected. 
• Consult the dealer or an experienced radio / TV technician for help. 
Changes or modifications not expressly approved by the party responsible for compliance could void the user's authority to operate the equipment. To 
comply with FCC RF exposure compliance requirements, a separation distance of at least 20 cm must be maintained between the antenna of this device 
and all persons. This device must not be co-located or operated in conjunction with any other antenna or transmitter


Although efforts are made to provide accurate electricity cost information, ALL COSTS ARE ESTIMATES FOR INFORMATIONAL PURPOSES ONLY, NOT FOR BILLING. 

Summary of Contents for In-Home Display

Page 1: ...limits for a Class B digital device pursuant to Part 15 of the FCC Rules These limits are designed to provide reasonable protection against harmful interference in a residential installation This equipment uses and generates radio frequency energy and if not installed and used in accordance with the instructions may cause harmful interference to radio communications However there is no guarantee t...

Page 2: ...mmary 5 Average daily comparison 5 Resetting Summaries 5 Your Historical Usage 6 Last 24 Hours kWh and 6 Last 24 Hours numerical history 6 Last 30 days kWh and 6 Last 30 days numerical history 6 Your Real time Usage 7 Current Usage 7 Light bulbs 7 Instantaneous 7 Reference 8 Main Menu 8 Preferences Menu 8 Language 8 User Interface 8 Number Format 9 12 24 hour time format 9 Setting Billing Date 9 A...

Page 3: ...meter connection During this time the Indicator Light Bar will glow red sweeping back and forth On the screen an antenna icon will appear to indicate that the IHD is searching When the meter connection is found the Summary view will be displayed If no connection is found after 10 minutes the message No Signal Found will be shown The device will continue to search for the meter connection At this p...

Page 4: ... and the Detailed Summary Light Bar The Light Bar glows Red Yellow or Green The Light Bar light moves from left to right appearing to rotate at a rate that corresponds to the amount of energy being consumed The higher the rate of consumption the faster the light will turn For Time of Use TOU the color is usually determined by the rate period and for volumetric use the colors are determined by whic...

Page 5: ... your daily consumption for today is lower than the week s average a happy face will appear NOTE each value reads 0 0 when first turned on Resetting Summaries Pressing the button in the Overall or Detailed Summary views accesses this menu NOTE Each billing period the summaries will automatically be reset to your billing date This can be manually adjusted to any date in the past if you wish to moni...

Page 6: ...n order This does not include any monthly base charges Last 30 days kWh and This screen displays up to 30 vertical bars showing the daily consumption kWh for the last 30 days excluding any data from the current day As the week progresses the graph adjusts such the most recent day of data is always added to the right side of the graph and the oldest day s data is removed from the left The current d...

Page 7: ...city use per hour at the present rate of consumption based only on variable costs Light bulbs Each light bulb represents 100W of electricity being used and corresponds to the number displayed in the previous screen rounded down to the nearest 100W increment If the amount of electricity is greater than the number of light bulbs that can be displayed 60 bulbs 6000 W the view will revert to the Curre...

Page 8: ...and then Set Backlight Use the UP or DOWN buttons to change the brightness Then press the Button to select the new setting To turn the tone on or off select User Interface Although efforts are made to provide accurate electricity cost information ALL COSTS ARE ESTIMATES FOR INFORMATIONAL PURPOSES ONLY NOT FOR BILLING and then Tone On Off Scroll to the desired option and press the Button to select ...

Page 9: ... buttons to increase or decrease the day of month setting Then press the Button to make the desired selection If you have more than one month per cycle you will be able to edit the number of months in the repeat every line Pressing the Button after the setting the number of months moves to the bottom line which indicates when the next billing date will be If you are on a multi month period you can...

Page 10: ...ess the Button to move to the next digit The digits include numbers and most letters When the last digit has been entered a confirmation message will be displayed If you wish to correct your activation code select No to go back and correct it If you are satisfied that you have entered the correct number select Yes to continue You will then move to the start up screen Note the activation code shown...

Page 11: ... be applied Electricity costs are calculated and stored using the IHD s rates in effect at the time the electricity is consumed New electricity rates will impact electricity costs as of their effective date and time A rate change will not alter stored electricity costs Electricity usage and cost data are stored every 15 minutes This information is displayed in various ways in the History and Summa...

Page 12: ... screen The large number on this screen matches the kWh reading on the smart electricity meter together with tier details if applicable Version Info Version information can be viewed from the System Info Menu Version Info displays the serial number for the IHD circuit board and its software and hardware versions The other lines contain troubleshooting information and the bottom corner shows intern...

Reviews: