


NetAtlas IES-1000 (AAM1008) EMS User’s Guide
Information Formats
5-5
Table 5-3 Graph Styles
STYLE
DESCRIPTION
Distribution
Each variable is displayed as a stacked vertical bar. Each segment of the bar represents the
amount of time that the variable value is within a certain range (as a percent). The legend on the
right side of the display shows the corresponding range for each color. The entire display
represents a single poll interval.
5.2.2
Chart Format Display Variable
Choose which variables to display in chart format by doing
one
of the following:
Click a variable cell in a table and click the bar chart icon.
Display the chart menu and then deselect variables (all are displayed by default).
Right-click a variable’s cell to bring up the
Edit Style
dialog box and select
Display
in the variables
Edit Style
dialog box.
5.2.3
Chart Color Codes and Line Styles
You may also edit the color code and line style for a variable in the
Edit Style
dialog box as described in the
following table.
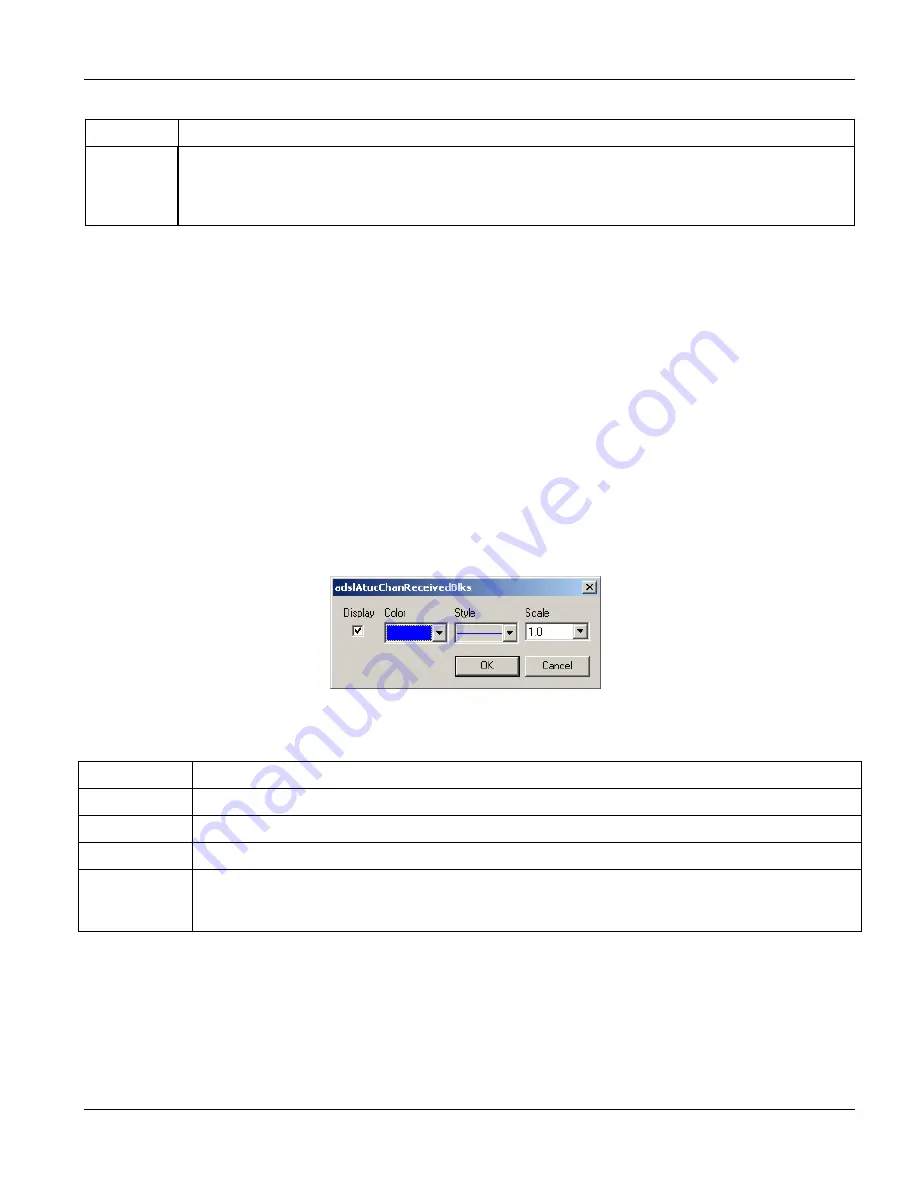
Figure 5-5 Edit Style Dialog Box
Table 5-4 Edit Style Dialog Box
FIELD
DESCRIPTION
Display Check
Display
to view information about this variable in chart format.
Color
Choose a color from this drop down list.
Style
Choose a line style from this drop down list.
Scale
Select the scaling multiplier from this drop down list. This factor is applied to each value in the line
before it is displayed and can be used to keep all graph lines within a similar range of values. The
range is from 0.0001 to 1000.0.