Carl Zeiss
Center Screen Area / Image Containers - Display and Image Analysis
Lightsheet Z.1
214
000000-1790-528
02/2013
4.8.7
Flying Mode
The
Flying
mode is an interactive way to explore three-dimensional data. By pressing the mouse wheel
you can fly into and through a dataset. Moving the mouse left / right and up / down controls the flying
direction. Pressing the mouse wheel and the right mouse button at the same time allows for flying
backwards.
Once the
Flying
mode is activated, the rotation of the data switches modes: Whereas normally the
data turns around an imaginative point in the center of the dataset, in the fly mode, the data turns
(if moved interactively with the mouse once one stops flying) around an imaginative point
"
behind
"
the operator. Pressing the
button switches back into the normal mode.
If a wheel-mouse is not available, pressing the
button turns the left mouse button into the
Flying
button.
The
Flying
mode is only available in graphics card accelerated render modes.
4.8.8
3D Rendering Settings in VisArt
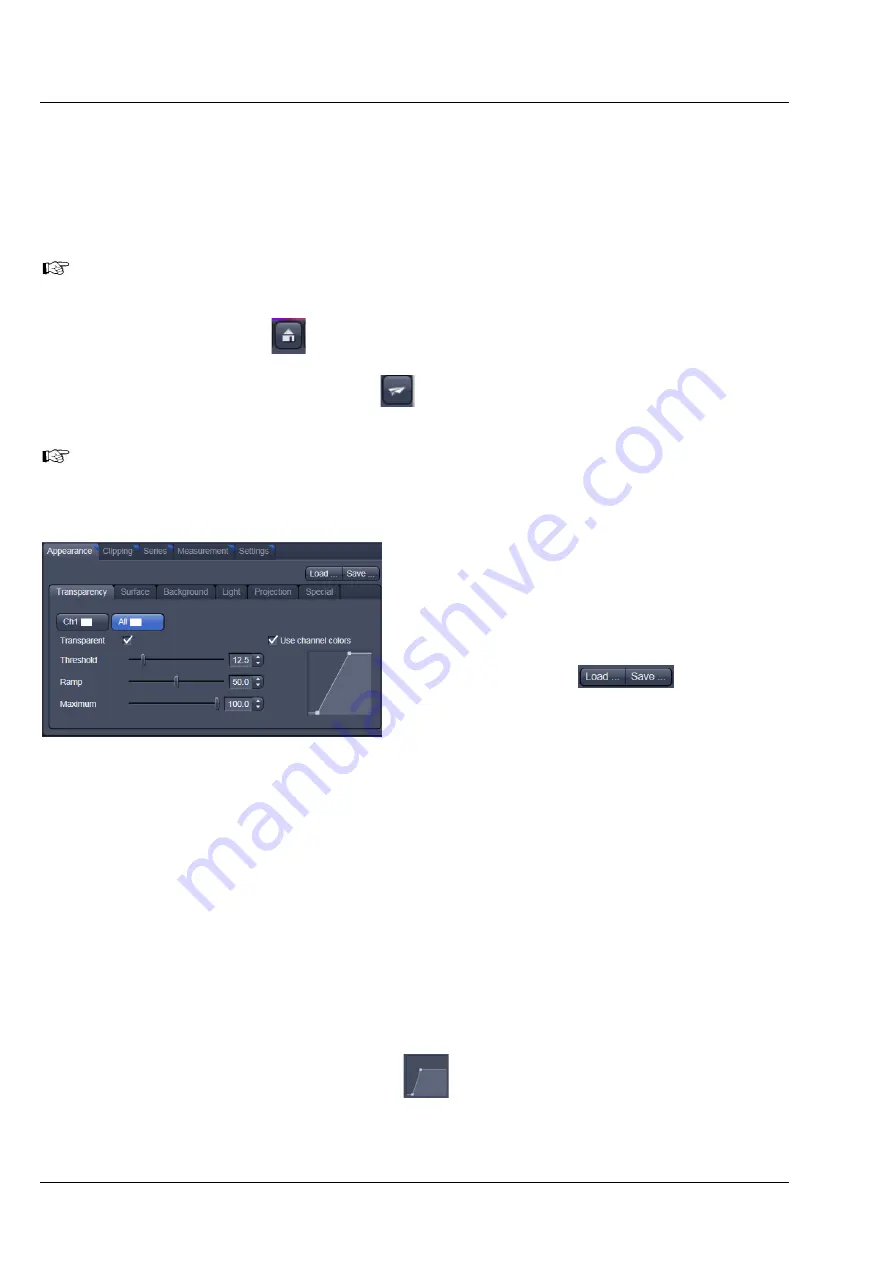
Depending on the render mode selected, the
following adjustments can be applied to the
datasets:
All settings can be saved and re-applied to other
datasets by using the
buttons.
−
Threshold
specifies a lower threshold as a
percentage of the gray values displayed. This
decides which data enter the rendered
image. If one fluorescence channel contains
a homogeneous fluorescence signal with
high signal strength, one would set the
threshold higher in order to "protect"
signals from weaker channels from being
quenched.
−
Ambient
describes a diffuse, non-directed light source, which lets both bright and dark structures
appear darker or brighter in an equal fashion (values on a scale between 0 and 100).
−
Specular
sets a directional brightness (values on a scale between 0 and 100). Influences the
differences between dark and bright structures, which are strongest at a value of 0.
−
Shininess
changes the surface gloss (on a scale between 0 and 100).
−
Ramp
controls the degree of the transition from completely transparent to completely opaque.
−
Maximum
influences the degree of opacity.
The settings are combined into a histogram
. The x axis corresponds to the gray values and
the y axis to the degree of opacity. You can also use the mouse to interact with the histogram
curve.
Fig. 320
3D Rendering window (e.g. Surface
Advanced rendering mode)
Summary of Contents for Lightsheet Z.1
Page 1: ...Lightsheet Z 1 Operating Manual February 2013 ZEN 2012 black edition ...
Page 4: ......
Page 170: ......
Page 427: ...Lightsheet Z 1 Overview ...


