


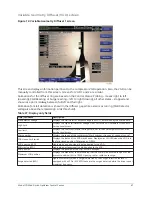


Surge protection screen
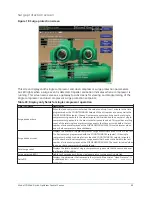
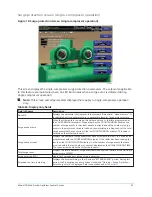
Figure 18: Surge protection screen
This screen displays both single compressor and dual compressor surge protection parameters.
An LED lights when a surge event is detected. Impeller animation indicates when a compressor is
running. This screen also serves as a gateway to subscreens for viewing and programming of the
single compressor and dual compressor surge protection setpoints.
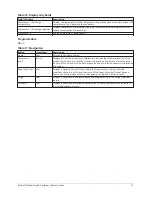
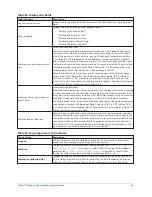
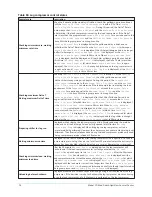
Table 39: Display only fields for single compressor operation
Field/LED name
Description
Surge window time
When the lead compressor is started, this value counts up from 1 minute to the time
programmed as the COUNT WINDOW Setpoint. When it reaches a count equal to the
COUNT WINDOW setpoint, it doesn’t increment anymore and the number of single-
compressor surge events in the oldest minute is discarded and the number of single–
compressor surge events in the most recent minute are added. This provides a rolling
count of the total single-compressor surge events that have occurred within the last
number of minutes displayed as the SURGE WINDOW TIME. This value is reset when
one or both compressors have shutdown.
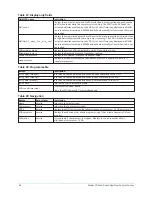
Surge window count
Displays the number of single-compressor surge events that have occurred in the last
1 to 5 minutes (as programmed with the COUNT WINDOW setpoint). If the single-
compressor has been running for less than the COUNT WINDOW setpoint minutes,
it is the number of dual-compressor surge events that have occurred within the last
number of minutes displayed as the SURGE WINDOW TIME. The count is cleared when
the one or both compressors have shutdown.
Total surge count
Displays the total number of single-compressor surge events that have occurred over
the lifetime of the chiller.
Surge detected (LED)
Lights for 5 seconds each time a single-compressor surge event is detected.
Delta P/P
Displays the parameter that represents the system differential or “Head Pressure”. It
is calculated as
(condenser pressure – evaporator pressure) / evaporator
pressure
.
55
Model YD Mod D with OptiView Control Center
Summary of Contents for YD Mod D
Page 2: ...2 Model YD Mod D with OptiView Control Center...
Page 8: ...Nomenclature Model YD Mod D with OptiView Control Center 8...
Page 17: ...Figure 2 Chiller operation flow chart 17 Model YD Mod D with OptiView Control Center...
Page 18: ...Figure 2 Chiller operation flow chart Model YD Mod D with OptiView Control Center 18...
Page 19: ...Figure 2 Chiller operation flow chart 19 Model YD Mod D with OptiView Control Center...
Page 20: ...Figure 2 Chiller operation flow chart Model YD Mod D with OptiView Control Center 20...
Page 21: ...Figure 2 Chiller operation flow chart 21 Model YD Mod D with OptiView Control Center...
Page 22: ...Figure 2 Chiller operation flow chart Model YD Mod D with OptiView Control Center 22...
Page 150: ...Figure 57 Sample printout status Model YD Mod D with OptiView Control Center 150...
Page 151: ...Figure 57 Sample printout status 151 Model YD Mod D with OptiView Control Center...
Page 152: ...Figure 58 Sample printout setpoints Model YD Mod D with OptiView Control Center 152...
Page 153: ...Figure 58 Sample printout setpoints 153 Model YD Mod D with OptiView Control Center...
Page 154: ...Figure 59 Sample printout schedule Model YD Mod D with OptiView Control Center 154...
Page 155: ...Figure 60 Sample printout sales order 155 Model YD Mod D with OptiView Control Center...
Page 156: ...Figure 61 Sample printout history Model YD Mod D with OptiView Control Center 156...
Page 157: ...Figure 61 Sample printout history 157 Model YD Mod D with OptiView Control Center...
Page 159: ...Figure 64 Sample printout custom screen report 159 Model YD Mod D with OptiView Control Center...