


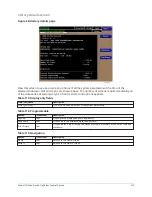


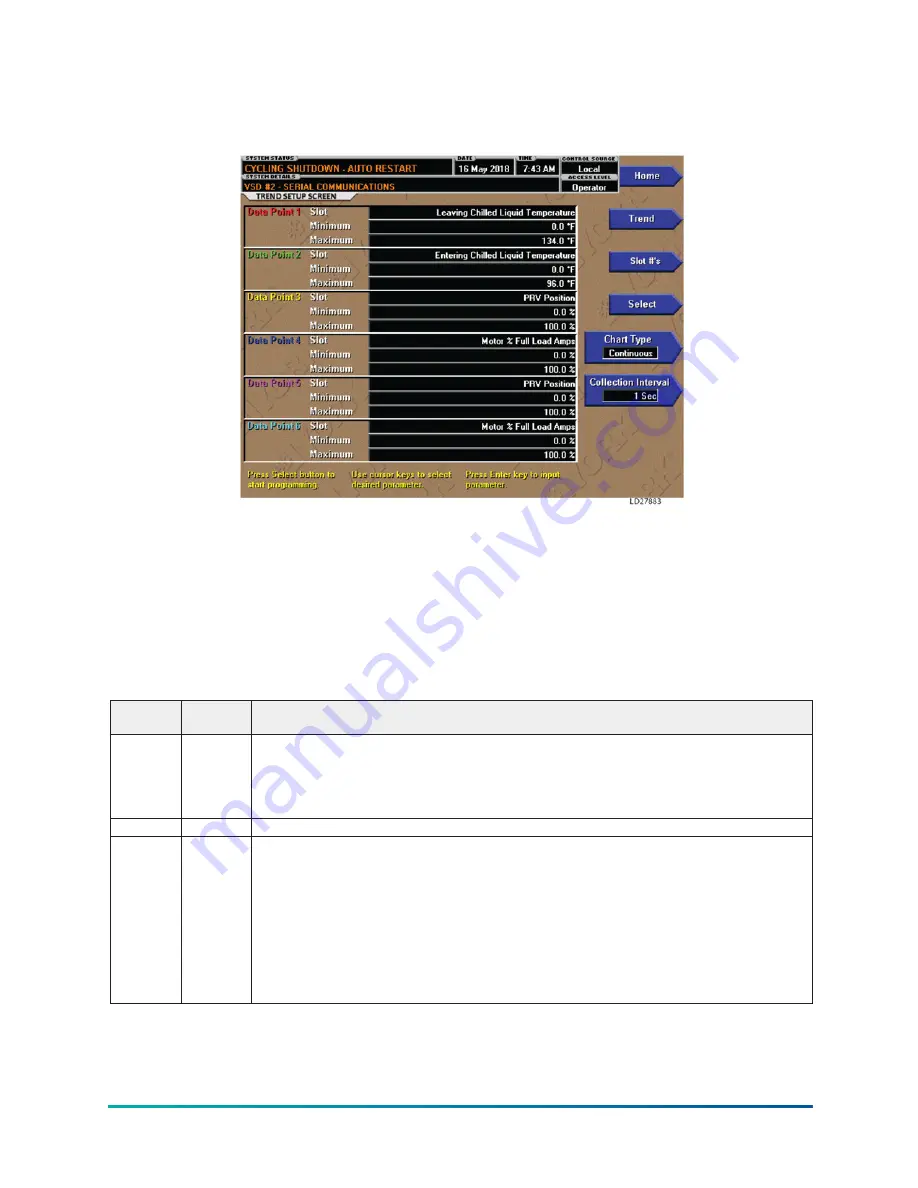
Trend setup screen
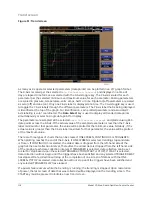
Figure 52: Trend setup screen
This screen is used to configure the trending screen. The parameters to be trended are selected
from the Common Slots Screen or Common Slots Master list and entered as Slot Numbers for Data
Points 1 through 6. The Y-Axis minimum and maximum values for each parameter are entered
as Data Point Min and Data Point Max for Data Points 1 through 6. The interval at which all the
parameters are sampled is selected as the Data Collection Interval.
Display only
None.
Table 129: Programmable
Button
Access
level
Description
Select
Operator
This key is used to enter the slot numbers and the minimum and maximum Y-Axis values of
each parameter to be trended. Pressing this key places a yellow box around Data Point 1 Slot
Number. Use the Up and Down navigation keys to place the box around the value of Data Points 1
through 6 to be changed. With the desired value selected, press the 3 key. A dialog box is displayed
permitting data entry.
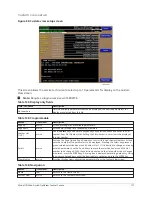
Chart type Operator
Selects continuous, one screen, or triggered type of graph.
Collection
interval
Operator
Selects the interval at which the parameters are sampled. There are 450 data points displayed
across the X-Axis of the graph. Each point represents the instantaneous value of the parameter.
The user selects the time interval between these points. This is called the DATA COLLECTION
INTERVAL, or the interval at which the parameter is sampled. This interval is programmable over
the range of 1 second to 3600 seconds (1 hour), in one second increments. The selected interval
not only determines the sample interval, but also the full screen time display. The full screen
time display is a result of the selected interval in seconds, multiplied by the 450 data points. For
example, if the Data Collection Interval is programmed for 900 seconds, the parameter would be
sampled every 900 seconds, with the last 112.5 hours (4.7 days) of data viewable on the screen.
Therefore, the selected interval is a compromise between resolution and full screen time display.
Model YD Mod D with OptiView Control Center
120
Summary of Contents for YD Mod D
Page 2: ...2 Model YD Mod D with OptiView Control Center...
Page 8: ...Nomenclature Model YD Mod D with OptiView Control Center 8...
Page 17: ...Figure 2 Chiller operation flow chart 17 Model YD Mod D with OptiView Control Center...
Page 18: ...Figure 2 Chiller operation flow chart Model YD Mod D with OptiView Control Center 18...
Page 19: ...Figure 2 Chiller operation flow chart 19 Model YD Mod D with OptiView Control Center...
Page 20: ...Figure 2 Chiller operation flow chart Model YD Mod D with OptiView Control Center 20...
Page 21: ...Figure 2 Chiller operation flow chart 21 Model YD Mod D with OptiView Control Center...
Page 22: ...Figure 2 Chiller operation flow chart Model YD Mod D with OptiView Control Center 22...
Page 150: ...Figure 57 Sample printout status Model YD Mod D with OptiView Control Center 150...
Page 151: ...Figure 57 Sample printout status 151 Model YD Mod D with OptiView Control Center...
Page 152: ...Figure 58 Sample printout setpoints Model YD Mod D with OptiView Control Center 152...
Page 153: ...Figure 58 Sample printout setpoints 153 Model YD Mod D with OptiView Control Center...
Page 154: ...Figure 59 Sample printout schedule Model YD Mod D with OptiView Control Center 154...
Page 155: ...Figure 60 Sample printout sales order 155 Model YD Mod D with OptiView Control Center...
Page 156: ...Figure 61 Sample printout history Model YD Mod D with OptiView Control Center 156...
Page 157: ...Figure 61 Sample printout history 157 Model YD Mod D with OptiView Control Center...
Page 159: ...Figure 64 Sample printout custom screen report 159 Model YD Mod D with OptiView Control Center...