2-17
IM 704510-01E
Explanation of Functions
3
2
1
4
5
6
7
8
9
10
11
12
13
14
15
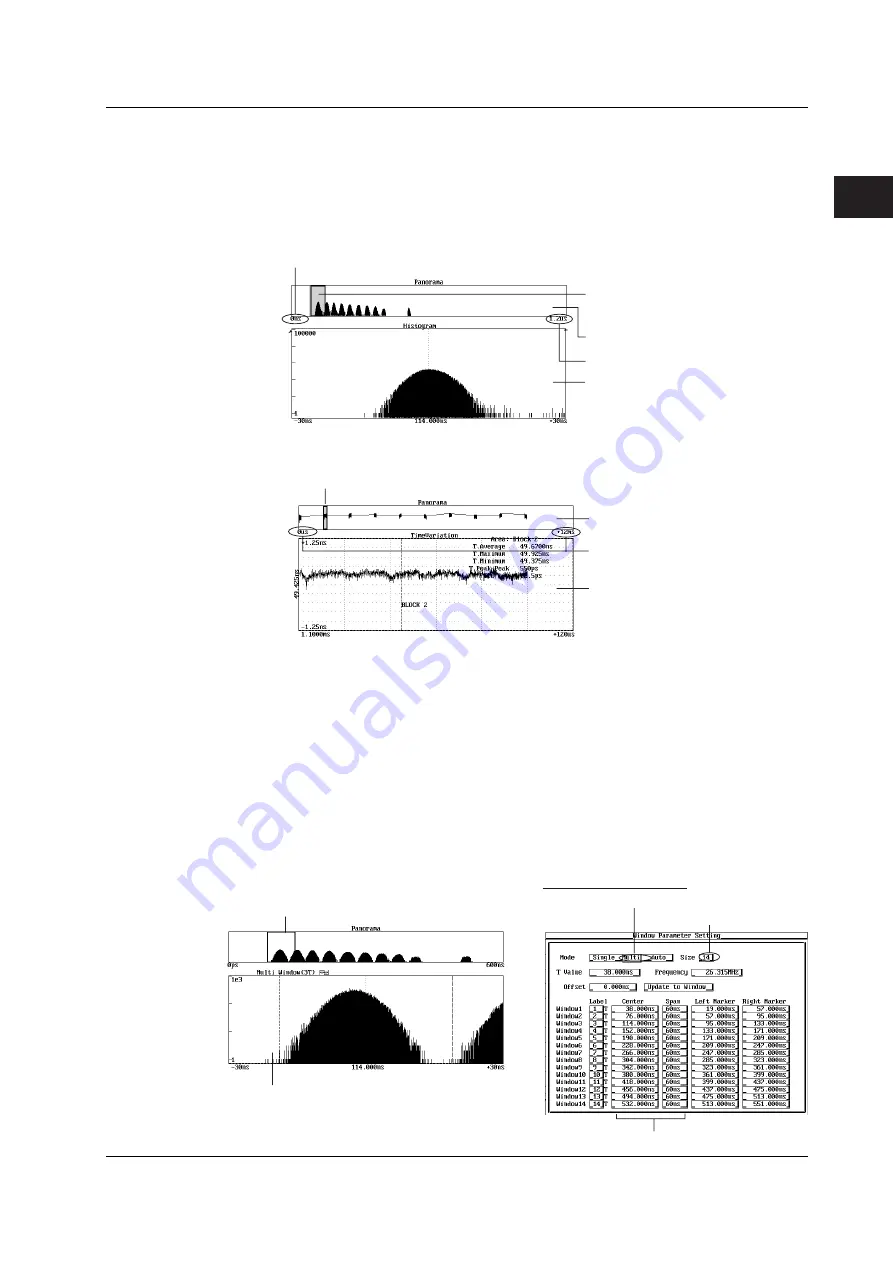
Panorama Display (see sections 7.1 and 7.3 for the operating procedure)
When showing the histogram display or time variation display, window displaying all the
measured data (called panorama window) can be shown at the top section of the main
window. On the panorama window, the histogram shown in the main down is indicated
with a zoom box.
Histogram display
Left end value of panorama display
Displays the histogram of the zoom
box on the main window
Panorama window
Right end value of panorama display
Main window
Time variation display
Displays the time variation waveform of
the zoom box on the main window
Panorama display area
Panorama window
Main window
Multi Window Function (see section 8.2 for the operating procedure)
When the distribution of the data of one measurement block is distributed over multiple
center values on the X-axis, multiple histograms are created. You can simultaneously
display all the histograms in the main window. However, you can also set multiple
windows and display each histogram in its own window and observe it in detail. The
function that allows for the setting of multiple windows and the display of the histogram of
each window is called the multi window function. Up to 14 window sizes (windows) can
be specified. In addition, the display range (scale value) can be arbitrary set for each
window.
By using this function in conjunction with the panorama display, you can easily see which
histogram among the various windows is being displayed or set.
Displays the 3T window on the main window
Window setup dialog box
Select multi window
Window size
Display range of each window
Main window
2.6 Displaying the Measured/Calculated Results


