1-20
IM AQ1200-01EN
1.12 Event Mapper
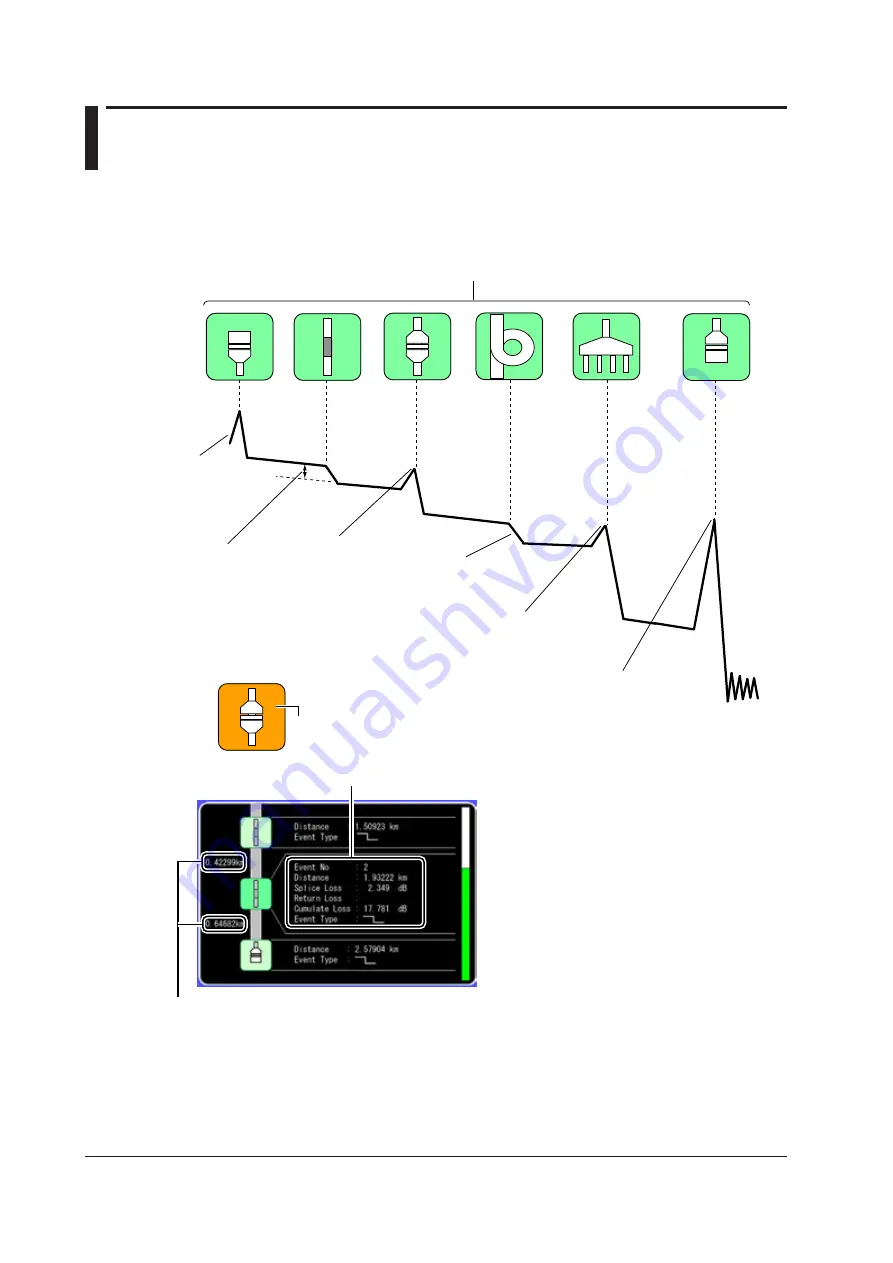
You can display measured result events as icons on the screen. Detailed event analysis results are
displayed along with the displayed icons. In addition, if fault events (see section 3.6) are specified,
icons are displayed in different colors depending on the results of pass/fail judgments.
Near-end
reflection
Splice loss
Reflection caused
by a connector
Loss caused
by bending
Reflection at the open end
of the fiber (Fresnel reflection)
Reflection caused
by a splitter
Each event is displayed as an icon. You can also switch to the waveform display using soft keys.
If an event is determined to be a fault event,
the icon background is displayed in orange.
Detailed analysis results of the selected icon (event)
Distance between events


