SonTek, a Xylem brand
138
RiverSurveyor S5/M9 System Manual (February 2013)
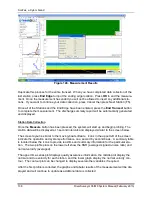
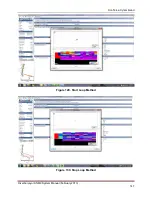
Figure 124. Measurement Results
Duplicate this process for the entire transect. When you have completed data collection of the
last station, press
End Edge
to input the ending edge location. Press
OK
to end the measure-
ment. Once the measurement has ended you will not be allowed to insert any additional sta-
tions. If you want to continue your data collection, press Cancel then press Next Station (F5).
Once all of the Stations and the End Edge have been entered, press the
End Transect
button
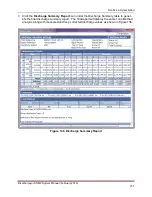
to complete the measurement. The discharge summary report will be automatically generated
and displayed.
Station Data Collection
Once the
Measure
button has been pressed, the system will start up and begin profiling. The
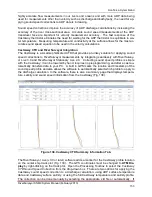
station data will be displayed at 1-second intervals and displayed similar to the screen below.
The screen layout is similar to the moving-boat software. Icons in the upper left of the screen
indicate the operation and system performance on a second by second basis. A summary table
is located below the icons to provide real-time and summary information for the particular sta-
tion. The two profile plots on the lower left show the SNR (averaged signal-to-noise ratio) and
normal velocity (averaged).
The upper time-series plot displays quality assurance information, the middle plot display the
normal and true velocity for each station, and the lower graph display the normal velocity con-
tour. The contour plot can be changed to display several other variables if required.
After the first profile is collected, the graphs and tabular results of the measurement will be dis-
played and will continue to update as additional data is collected.


