5.6. REAL-TIME GRAPH
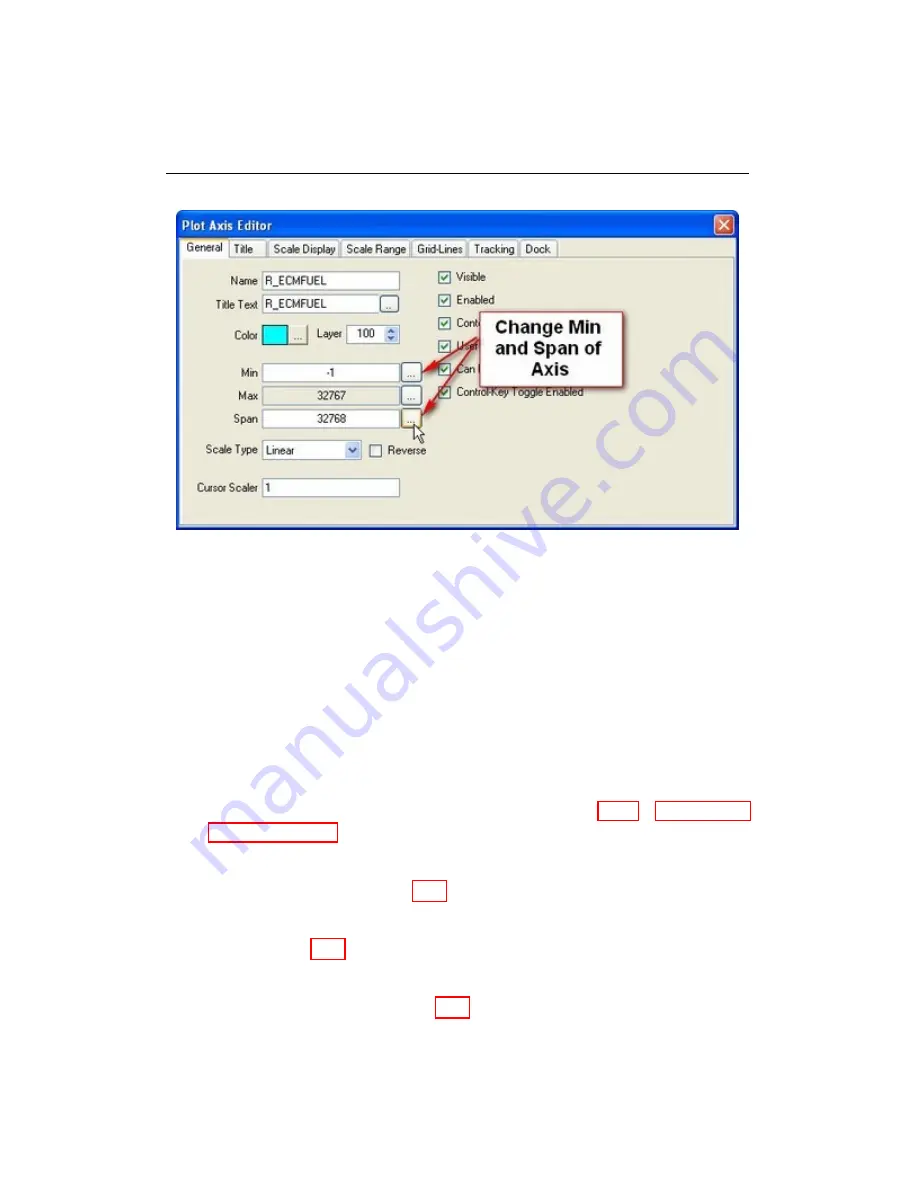
Figure 5.22: Change axis scale
5.6.5
Data Logging with the Real-time Graph
Data can be viewed and logged at the same time via the Real-time Graph.
NOTE:
WEST has a slight delay when displaying the externally logged
data. Therefore, the real-time graph should only be used for relative
data comparison, since the values displayed on the graph take time to
process before they are visible to the user.
a. Ensure that the
Real-time Graph
window is already open. For instructions
on how to open the Real-time Graph, see
Section 5.6.1 - Opening the
b. The logging speed can be set by changing the
Est. Rate XX Hz
from
the pull down menu (Fig. 5.23).
c. When enough data has been collected, press the
Save Data Log
button (Fig. 5.24).
d. A window will appear; select the location to save the log, enter a
File
Name
, and click
Save
(Fig. 5.25).
WEST User Manual
46
Summary of Contents for WEST ADR 80/02
Page 1: ...WEST USER MANUAL V4 4 1031 Westport 15L System EPA07 EPA10 EPA13 ADR80 02 ADR80 03 ...
Page 2: ... This page is intentionally left blank ...
Page 19: ...2 2 SOFTWARE INSTALLATION Figure 2 5 Installation complete WEST User Manual 7 ...
Page 25: ...2 3 WEST HARDWARE SETUP Figure 2 10 USB connection problem message WEST User Manual 13 ...
Page 51: ...5 5 AUTOMATED NO LOAD TRIM ANT Figure 5 15 ANT screen WEST User Manual 39 ...
Page 72: ...7 2 CALIBRATION INFORMATION Figure 7 2 Calibration Information Window WEST User Manual 60 ...


