70
•
SmartSensor V User Guide
Logging events
1
Click the
Event Logging
button to turn on event logging.
2
If there's no file, you'll be prompted to create a new one.
3
When you're finished logging data, click the
Event Logging
button again.
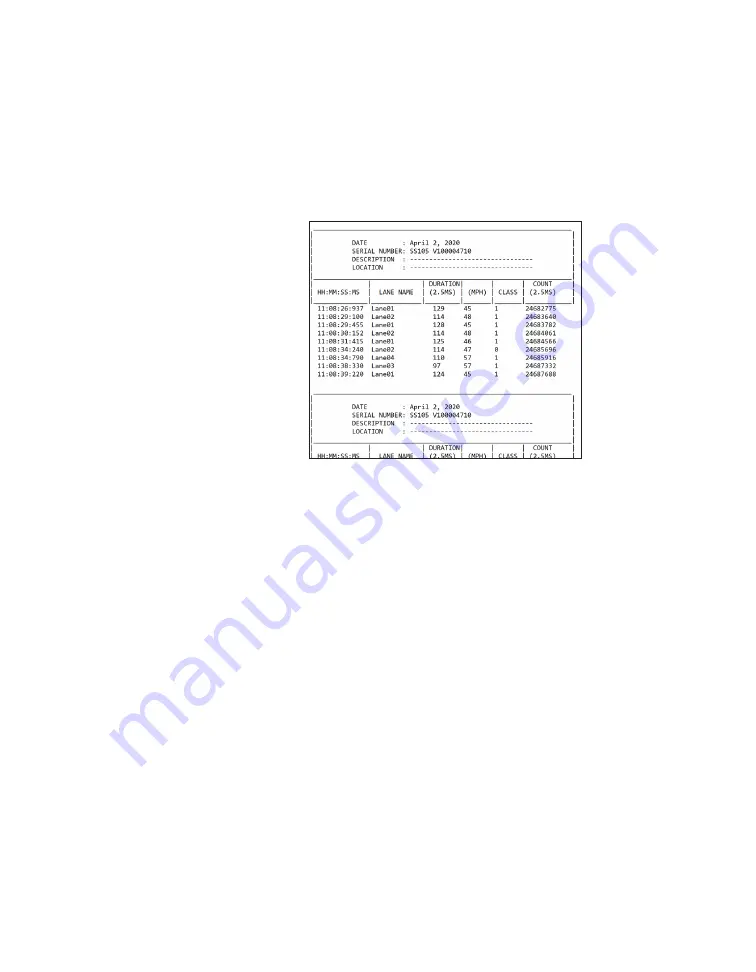
Viewing the event data log
Figure 60.
Event log
Click the
View Event Log
button to open the current event log file
in a text editor, such as Notepad. The event log file breaks down
each event and reports back the event timestamp, lane name,
duration, event speed, class, and count.
˿
HH : MM : SS : MS –
The time the vehicle entered the detec-
tion zone. This is formatted using the local time zone settings
on your computer in hours, minutes, seconds, and milliseconds.
˿
Lane name –
A string of eight alphanumeric characters that
describe the lane.
˿
Duration (2.5ms) –
The number of 2.5 ms ticks that elapsed
while the vehicle was in the sensor’s detection zone.
˿
(MPH) –
This represents the speed of the vehicle, displayed
either in miles per hour (mph) or kilometers per hour (kph).
˿
Class –
This indicates into which one of three length-based
classification groupings (0=Small, 1=Medium, and 2=Large) the
vehicle fits.
˿
Count (2.5ms) –
The time the vehicle entered the detection
zone encoded as the number of 2.5 ms ticks counted on the
sensor since the beginning of the day (UTC time).
Note.
Event logging
remains on as long
as you are in the
Traffic (Event Data)
screen. If you switch
to another screen
in SmartSensor
Manager, and then
come back to the
Traffic (Event Data)
screen, event
logging will have
been turned off.
Note.
You can also
create a new file
by going to
File
>
Data Logs
>
New
.
Note.
Each time
the
Event Logging
button is clicked,
a new header is
created in the log file.


