


38: Configuring data usage monitor
_______________________________________________________________________________________________________
_______________________________________________________________________________________________________
© Virtual Access 2018
GW2020 Series User Manual
Issue: 2.1
Page 401 of 423
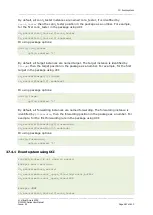
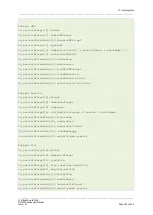
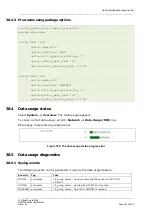
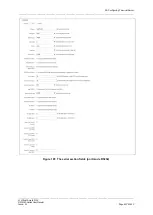
38.3.3
Procrustes using package options
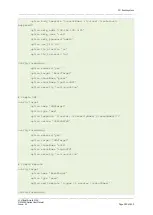
root@VA_router:~# uci export procrustes
package procrustes
config limit 'lan'
option enabled '1'
option interfaces 'LAN1'
option billing_period_start_day '1'
option monthly_data_limit '30'
option monthly_warning_levels '15 25'
config limit 'wan'
option enabled '1'
option interfaces 'MOBILE1'
option billing_period_start_day '1'
option monthly_data_limit '30'
option monthly_warning_levels '15 25'
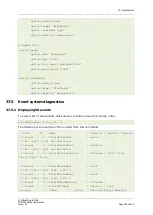
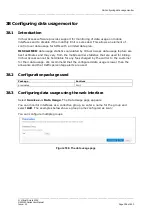
38.4
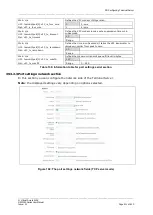
Data usage status
Select System -> Overview. The Status page appears.
To check current data usage, scroll to Network -> Data Usage (MiB) row.
Data usage is presented as progress bar.
Figure 188: The data usage status progress bar
38.5
Data usage diagnostics
38.5.1
Syslog events
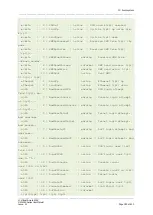
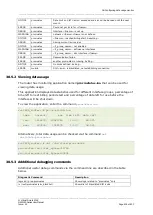
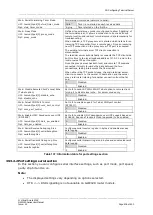
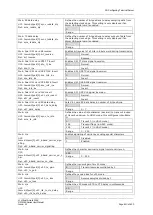
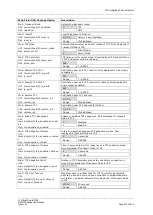
The following events can be generated in logs by the data usage feature:
Severity
Tag
Text
NOTICE
procrustes
<if_group_name>: using counter 1404674 saved on 2017-09-30
16:26:57
NOTICE
procrustes
<if_group_name>: warning level 2097152 is reached
WARNING procrustes
<if_group_name>: hard limit 10485760 is reached