background image

VibrationVIEW Help

171

© 1995-2005 Vibration Research Corporation.  All rights reserved.

1.

Select the input type using the radio buttons directly below the "Input file" button.

2.

Click the "Input file" button to select the file from which to read the data.  The file will be scanned,
and the dialog box will be updated to reflect the contents of the file.

3.

Set the sampling rate, number of header lines, the column number for the acceleration data, and
the acceleration units used in the file.

4.

Select the spectrum generation method.  The import procedure divides the file into 1024-sample
blocks, computes the spectrum for each block, and then combines them according to the selected
method.  "Average" will average all of the spectra together using a uniform average.  "Peak hold"
will extract the peak values over all of the blocks at each frequency.

5.

Click the "Create Table" button to process the file and create the frequency/amplitude breakpoint
table from the input file.

To input data from an analog input channel on the 

VibrationVIEW

 I/O unit, perform the following

procedure:

1.

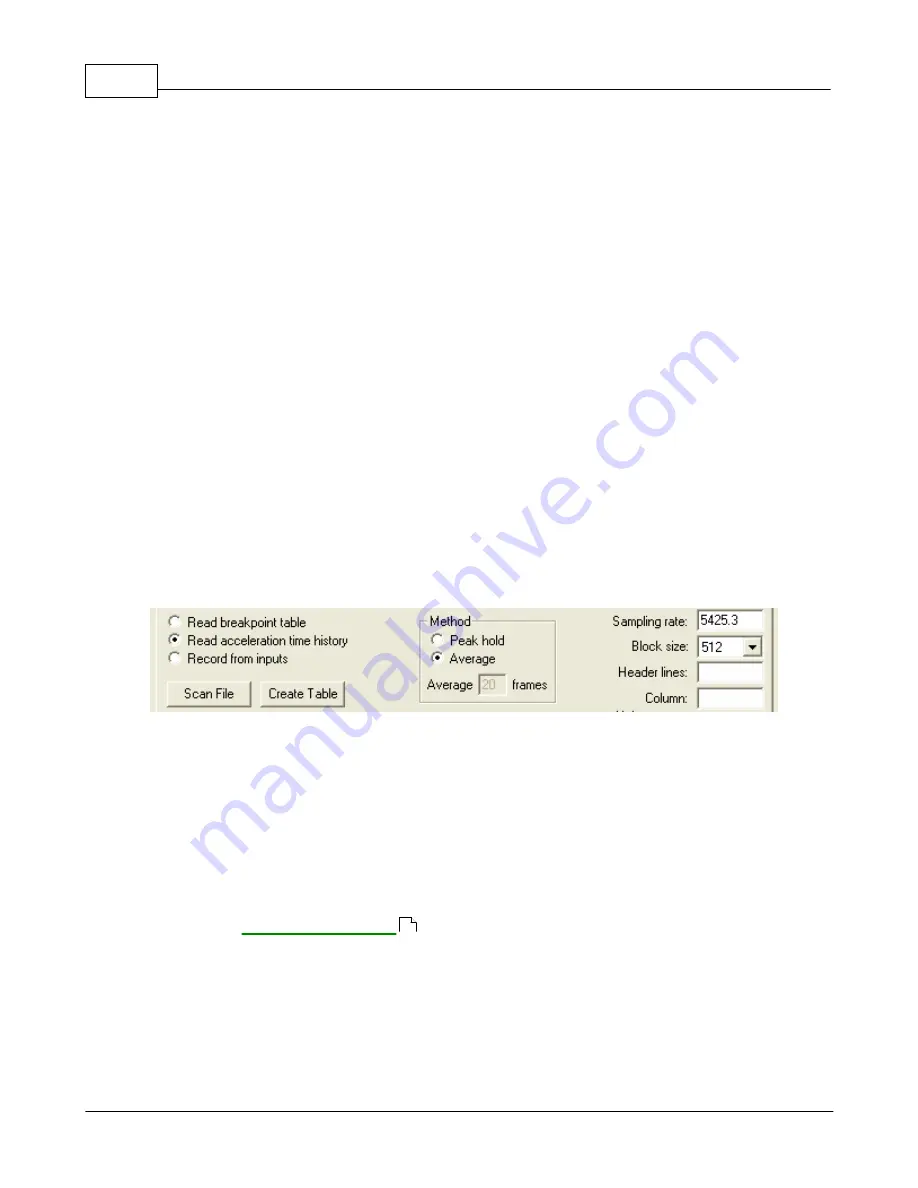
Select the "Record from inputs" radio button, as shown in the figure below.

2.

Select the spectrum generation method.  "Peak hold" will keep the peak acceleration level seen at
each frequency.  "Average" will perform an exponentially-weighted average of the input data, with
the amount of averaging determined by the 

Average XX frames

 parameter.  Higher averaging

values will result in more averaging and therefore smoother spectra.

3.

Select the input channel, mV/G setting and desired sampling rate.  The sampling rate should be
2.6 times the highest desired frequency to be used in the test.  An anti-aliasing filter on the input
will remove the higher frequency components from the signal.

4.

Connect the input source to the selected analog input channel on the 

VibrationVIEW

 I/O unit.

5.

Start playback on the input source (e.g. if using a DAT record, click the Play button).

6.

Click the "Start" button to start recording.  When finished, click the "Stop" button.

7.

Click the "Create Table" button to process the input and create the frequency/amplitude breakpoint
table from the data.

Figure:

 Generate a random test profile table from the analog input signals.

The Random Import feature is an optional feature and requires the software key be programmed to
enable it.

4.4

Shock Test Definition

4.4.1

Pulse tab

Shock Test Settings dialog box

Selecting the 

Test..Edit Test Settings

 menu command while a Shock test is open displays this

dialog box.

110

Summary of Contents for VibrationVIEW

Page 1: ...May 2005 Vibration Research Corporation VibrationVIEW Manual Vibration Research Corporation 2385 Wishere Dr Suite A Jenison MI 49428 USA PH 616 669 3028 FAX 616 669 5337 www vibrationresearch com ...

Page 2: ...bration Research Corporation for your vibration control needs For recent tips regarding our products please visit the support section or our website at www vibrationresearch com faq htm Check out the latest pdf file of Tips Tricks as well as the How to section ...

Page 3: ... to enter a Field Data Replicator test 25 4 How to run tests 25 How to run the System Check 26 How to run a Sine test 26 How to run a Random test 27 How to run a Classical Shock test 27 How to run a Field Data Replicator test 28 How to display and print graphs 29 How to store and retrieve data 30 How to export data 30 How to use memorized drives to instantly start tests 31 5 How to tune the contro...

Page 4: ...rameter names 74 Field Data Replicator report parameter names 77 TEDS accelerometer report parameter names 78 Sine report graph types 79 Random report graph types 80 Shock report graph types 81 Field Data Replicator report graph types Part III Menu commands 84 84 1 Overview 84 2 File menu 84 Open Data File 84 Recent Data Files 84 Save Data File 85 Save as 85 VibrationVIEW Data File 85 Report Docum...

Page 5: ...ave As New Test Defaults 111 Close Test Profile 111 Run Test 112 Stop Test 112 Advance to next level 112 Test Sequencer 112 Reset Filter Values 113 Generate Random Profile 113 Save Current Drive 114 Create Standard Drive File command 114 Create Resonance Table 114 5 Record menu 114 Record Data command 115 Record Data Stop command 115 Record Data Pause command 115 Record Data Edit Waveform command ...

Page 6: ...3 Test Tabs 123 Status Bar 123 Tool Tips 123 Tool Bar Text 123 Control Buttons 124 Accelerometers 124 Recorder Buttons 124 Motor Controls 124 Cursor Window 124 Sine Big Display 125 Sine COLA Slip 125 Reset Control Buttons 125 9 Window menu 125 New Window 125 Cascade 125 Tile Horizontal 125 Tile Vertical 126 Arrange Icons 126 1 2 126 10 Help Menu 126 Help 126 Contents and Index 126 Context Help 127...

Page 7: ...age tab 163 R o R tab 165 S o R tab 167 Notch tab 169 Import tab 171 4 Shock Test Definition 171 Pulse tab 173 Schedule tab 176 Parameters tab 178 Limits tab 180 Channels tab 182 Data Storage tab 183 Import tab 185 Breakpoints tab 187 SRS tab 189 5 Field Data Replicator Test Definition 189 Playback tab 191 Schedule tab 193 Parameters tab 195 Limits tab 197 Filter tab 199 Data tab 200 Import tab 20...

Page 8: ...set 221 Desired Acceleration is too high 221 Desired Displacement is too high 221 No acceleration detected on Channel 1 System Check Stop Code 222 Desired Velocity is too high 222 Emergency Stop 222 Computer Entering Suspend Mode 222 Lost Contact 222 Max Sine Acceleration 223 Max Sine Displacement 223 Max Sine Velocity 223 Remote Monitor High 223 Remote Monitor Low 224 Test Parameters Changed 224 ...

Page 9: ...Suspend Mode 231 Lost Contact 231 Max Sine Acceleration 231 Max Sine Displacement 232 Max Sine Velocity 232 Max Start Drive 232 Remote Monitor High 233 Remote Monitor Low 233 Resonance Min Drift Limit 233 Resonance Max Drift Limit 233 Run System Gain Limit 233 Startup System Gain Limit 234 Test Parameters Changed 234 Watchdog Timeout 234 4 Random Stop Codes 234 Front Panel Start 234 Front Panel St...

Page 10: ...Velocity 240 Max Run Voltage 241 Remote Monitor High 241 Remote Monitor Low 241 Run System Gain Limit 241 Test Parameters Changed 241 Watchdog Timeout 242 6 Field Data Replicator Stop Codes 242 Changing Level 242 Doing Digital Record 242 End of Test 242 Front Panel Start 242 Input channel N is clipping 243 Open Accel 243 Front Panel Stop 243 Waiting for operator 243 Remote Start 243 Record Active ...

Page 11: ...e 252 4 Random 253 5 Classical Shock 254 6 Field Data Replicator Part IX Dialog Boxes 257 257 1 Overview 257 2 System Check Dialog Boxes 257 System Check Graph Settings 258 System Check Graph 259 3 Sine Dialog Boxes 259 Sine Graph Settings dialog box 260 COLA Slip Frequency dialog box 260 Edit Frequency dialog box 261 Select Resonance Frequencies dialog box 263 Sine Big Display dialog box 264 Sine...

Page 12: ...og box 281 Motor Controls 281 Motor Define Dialog 281 Notice Message dialog box 281 Password Entry dialog box 282 Sine Test Settings Error 282 Random Test Settings Error 283 Rear I O Test Panel dialog box 283 Recently run tests 283 Recent Stop Codes 284 Remote Input Calibration 285 Registry Security Error 285 Run Name dialog box 286 Schedule Loop dialog box 286 TCP IP Server Failed to start 286 Te...

Page 13: ...ation Software 301 2 Appendix B 302 Overview 302 Ground Loop 302 Tips and Tricks Sheet 304 Earthquake Beat Test 305 Power Outage Tips 305 Custom Report Tips 307 Compression Rate 308 SRS Graphing Hints 308 Adobe Audition 309 3 Appendix C Index 311 XI Contents XI 1995 2005 Vibration Research Corporation All rights reserved ...

Page 14: ...ate your shaker system Optional modules include Sine Random Classical Shock RecorderVIEW Field Data Replication Sine on Random and Random on Random Vibration Research Corporation pioneered Field Data Replication exactly replicating data recorded in the field on the shaker in your lab Waveform RecorderVIEW allows you to stream data including your complete test history from the VR8500 inputs to your...

Page 15: ...Document Revision Part I ...

Page 16: ...ny license to these patents trademarks copyrights or other intellectual property Products that are referred to in this document may be either trademarks and or registered trademarks of the respective owners The publisher and the author make no claim to these trademarks While every precaution has been taken in the preparation of this document the publisher and the author assume no responsibility fo...

Page 17: ...How To Part II ...

Page 18: ...ts connecting the VR8500 unit to your computer and shaker read How to install the hardware installing the software read How to install the software Once the VR8500 hardware is connected and the software is installed then you can get started using the software as follows 1 Run VibrationVIEW by double clicking the VibrationVIEW icon on the desktop 2 Set the accelerometer mV g levels as described in ...

Page 19: ... the minimum requirements of your Operating System Dedicated 10 100 Ethernet port required for VR8500 connection Optional second network adapter for your internal network needs VGA compatible or higher display adapter Screen resolution of 1280 x 1024 and True Color recommended A flat panel LCD display is highly recommended due to electromagnetic interference This interference can reduce the clarit...

Page 20: ...equires approximately 195 MB of free hard disk space but the hard disk space may range from between 120 MB and 295 MB depending on your computer configuration and the options that you choose to install A full install of Windows 98 on a FAT16 drive requires 225 MB of free hard disk space but may range from between 165 MB and 355 MB depending on your computer configuration and that options that you ...

Page 21: ...provides further safety measures for lab personnel as well as testing equipment and products under test The following feature requires the software version 4 1 10 or later earlier versions require Wired Remote Control Option VR655 or the Shaker Monitor Analog DC Monditor Inputs which includes VR655 VR629 Emergency Stop Switch VR8500 ES The Emergency Stop Switch or E Stop provides lab personnel wit...

Page 22: ...ation Research for additional information 2 2 5 How to install the hardware How to install the hardware Connecting the VibrationVIEW I O hardware 1 Set up the computer in the conventional configuration with power cables mouse keyboard and monitor 2 Connect the VR8500 network port to the dedicated network card in the computer using the included yellow crossover cable If your VR8500 is labeled Adapt...

Page 23: ... shaker amplifier s input to the Drive output connector on the second VR8500 5 Connect accelerometer channels 1 4 to channels 1 4 of the first VR8500 accelerometer channels 5 8 to channels 5 8 on the second VR8500 accelerometer channels 9 12 to channels 9 12 on the third VR8500 accelerometer and channels 13 16 to channels 13 16 on the fourth VR8500 2 2 6 How to stack multiple 8500 units How to sta...

Page 24: ...ng steps it is assumed that the VibrationVIEW CD supplied with the system is in the CD ROM drive R and that the Windows NT system directory is C WINNT Adjust these to match your system configuration When you are logged in as Administrator perform the following steps 1 Run the program R installer exe on the CD ROM where R is the drive letter for your CD ROM drive 2 Select Install VibrationVIEW from...

Page 25: ...isplay the name assigned when the network card was installed typically Local Area Connection 2 Double click on the Local Area Connection 2 and click on the Properties button 6 Remove the check marks from Client for Microsoft Networks and File and Printer Sharing for Microsoft Networks Select Internet Protocol TCP IP and click the Properties button to continue 7 Assign address 192 168 3 10 and subn...

Page 26: ...VIEW Help 13 1995 2005 Vibration Research Corporation All rights reserved 8 Click the Advanced tab in the Properties dialog box Make sure Internet Connection Sharing for this connection is unchecked NOT enabled ...

Page 27: ...red to use the appropriate network connection after the network is setup Start VibrationVIEW by double clicking the VibrationVIEW icon on the desktop Select the Configuration Hardware menu command 10 Select the network card previously configured Typically this will be 192 168 3 10 Click the apply button ...

Page 28: ...wn menu for Channels 1 4 when it initially connects to the computer Select the appropriate VR8500 serial number to configure channels 1 4 and optionally channels 5 8 channels 9 12 and channels 13 16 The VR8500 control boxes are assigned addresses from the range listed in the Control Boxes Address parameters This does not need to be changed ...

Page 29: ...nput can be configured as single ended differential and optionally capacitor coupled Single ended inputs can also provide a constant current source to power your accelerometers Other types of accelerometers such as charge coupled accelerometers require external conditioning When the appropriate values are entered click the OK button The new accelerometer sensitivity factors will take effect immedi...

Page 30: ...lds in the Demo Registration form and click the Email Request Form button to request an activation code This will e mail the registration information you have entered to Vibration Research Corporation Note you can also fax or phone in the registration information if you don t have e mail available 5 You should receive a response e mail within 15 minutes during normal business hours Monday Friday 8...

Page 31: ...ear of VR8500 If the power light fails to illuminate verify that the power cord is plugged into a live outlet and the power switch is turned on If the Power light ever flashes or flickers while the power switch is turned on the unit may require service Contact Vibration Research for assistance Status Flashing with one flash every 2 seconds one second on one second off indicates that the box has no...

Page 32: ...t perform the following procedure 1 Select the Test System Check menu command to switch the system into System Check mode 2 Select the Configuration Inputs menu command Verify that your accelerometer sensitivity and power source settings are configured appropriately The constant current source is enabled in this dialog box If you are using constant current accelerometers or a conditioner that requ...

Page 33: ...r shaker system To enter the system mass select the Configuration System Mass menu command Enter the masses for all the shaker parts on your system If your system does not have one of the listed parts enter zero for that item s mass The sum of these mass values is used to calculate the maximum operating acceleration for your system using Newton s law Force mass acceleration 2 2 15 How to calibrate...

Page 34: ...and channel 1 and a second cable between the COLA AUX output connector and Channel 2 Click the Next button 13 The VR8500 will cycle through all the sample frequencies and calibrate both outputs to the inputs 14 When the calibration is complete click the Next button one more time to make calibration permanent Warning This will overwrite the previous calibration information in the VR8500 so be sure ...

Page 35: ...If monitoring channels are being used enable the appropriate channels in the Sine Channels dialog box and enter the plus and minus abort limits for the monitor channel All limits are measured in dB relative to the demand signal at the active frequency The tolerance lines are reference lines shown on the graphs brown dashed lines and are used to determine when to switch to Run mode when starting a ...

Page 36: ...lative to the demand signal The tolerance lines are reference lines shown on the graphs brown dashed lines and are used to determine when to switch to Run mode when starting a test When the number of lines outside the abort limits exceeds the Max Outlier the test will be aborted The abort lines are shown on the graphs as solid red lines The Max System Gain and Output Threshold parameters are safet...

Page 37: ...o Run mode when starting a test The Plus and Minus aborts are limits that when exceeded cause the test to abort The limits on the allowable drive voltage are also entered here 5 Channels Select which channel or channels you want to use as the control signal here When selecting multiple channels the time waveforms of the selected channels are averaged together 6 Data Storage The directory into whic...

Page 38: ...e accelerometer connected to channel 1 The Output Drive limits are also entered here 6 Filter The frequency range over which the controller will operate is entered here Typically one would select control from 0 Hz up to 40 of the sampling rate If you wish to filter out low frequencies to limit the displacement requirements or filter out high frequencies to avoid shaker resonances a smaller frequen...

Page 39: ...e select the Test Test Type Sine menu command 2 You may click on the TestType button on the toolbar or select the Test Test Type menu item to bring up the Test Type selection box Choose Sine and click on the OK button 3 If you would like to run a Sine test from a saved test profile select the Test Open Test Profile menu command or click the Open test toolbar button A list of test names will be dis...

Page 40: ...st Test Type Select Test Type menu item to bring up the Test Type selection box Choose Shock and click on the OK button 3 If you would like to run a Shock test from a saved test profile select the Test Open Test Profile menu command or click the Open test toolbar button A list of test names will be displayed Select Files of type VibrationVIEW Shock Profiles vkp and select the test you wish to run ...

Page 41: ...ield Data Replicator Graph Settings dialog box Several keyboard and mouse shortcuts are available to manipulate the graph display Ctrl A to autoscale the vertical Y axis Ctrl C to copy the graph to the Windows Clipboard Ctrl D to toggle the cursor display Ctrl F to autoscale both the vertical and horizontal axes Ctrl G to edit the graph settings Ctrl N to create a new graph window Ctrl Q to autosc...

Page 42: ...utput if you select the BLACK AND WHITE mode rather than the COLOR mode when creating a new graph To change a graph from color to black and white edit the graph settings by selecting the Graph Edit Graph Settings menu command or clicking the Edit Graph toolbar button change the style from Color to Black and White and click the OK button 2 4 7 How to store and retrieve data How to store and retriev...

Page 43: ...test are saved to the hard drive This data can be directly imported into Excel From Excel select the File Open menu command Change the Files of type drop down box to display Text Files prn txt csv Select a previously saved data file and click Open How to export a Text File To store the data for the current test select the File Save As Text File menu command A dialog box will appear prompting you f...

Page 44: ...e Test Settings dialog box to save the test Note The Memorized Drive option in test schedule levels 2 and above always use the output signal at the end of the previous level to determine the memorized drive signal Therefore these may be enabled without first selecting the Save Current Drive menu command Save Current Drive applies only to the first level in the test schedule 2 5 How to tune the con...

Page 45: ...2 5 times the maximum frequency in the test specification To tune the output drive safety limits click on the Limits tab Start with the settings Startup Max System Gain 5 V G Startup Output Threshold 0 005V Startup Max Output 1V Running Max System Gain 5 V G Running Max Output 1V The Startup Max System Gain and Startup Max Output parameters are safety limits that are used to shut down the system w...

Page 46: ...t different frequencies If a test is incorrectly aborted due to a Max Run Drive error increase this value The maximum output voltage required for a test can be determined by running a single sweep of the test After completing one sweep find the highest output voltage on the Output Drive graph the cursor display function may be helpful in finding this value Enter 1 5 times the maximum value for the...

Page 47: ...ng a test close to the displacement limits of your shaker you should use the highest number of lines possible to better filter out the frequencies below the lowest frequency in your test specification However increasing the number of lines means the controller must gather more data before computing the frequency spectrum which slows down the responsiveness of the system If the system is responding...

Page 48: ...tarts up when the test starts Reduce this value if the sine tone overshoots the desired level at test startup Typically 10dB second works well The Fractional Bandwidth and Maximum Bandwidth parameters set the bandwidth of the tracking filters used to extract the sine tones from the random background The bandwidth used is the smaller of the two values so the fractional bandwidth applies to lower fr...

Page 49: ...n and then the Stop button The controller will output a single pulse Compare the time delay between the demand pulse and the input pulse to see the lag in your system The Sample Rate parameter generally should always be set to Automatic to have the controller automatically select a suitable sample rate Advanced users may switch this to manual mode to force the system to use a specific sample rate ...

Page 50: ... the control overshoots the desired level then decrease the Startup Rate parameter The Abort Rate parameter determines the rate at which the output voltage will decrease to zero when the test is stopped or aborted In general a 6dB Spectrum Control SNR setting works very well However if your demand waveform is very small and close to the noise level you may need to reduce this setting to improve th...

Page 51: ... now initialized to replay this newly recorded file 2 6 2 How to import a waveform from a UFF file How to import a waveform from a UFF file To convert from UFF to VFW use the following procedure 1 Change to the Field Data Replicator test mode by selecting the Test Test Type Field Data Replicator menu command 2 Load the desired test or Define a new test 3 Click the Settings button on the Toolbar 4 ...

Page 52: ...ram Files VibrationVIEW Drive but any directory on the hard disk may be used 7 Set the number of Header Lines to the number of lines to discard at the beginning of the file This is used for example if the first few lines in the file contain a description of the data If the data begins on the first line of the file use 0 for the number of header lines 8 If more than one value is shown per line sepa...

Page 53: ...choose a new profile name 2 6 6 How to export a waveform to a Windows WAV file How to export a Field Data Replicator waveform to a Windows WAV file To convert from FDR to WAV use the following procedure 1 Change to the Field Data Replicator test mode by selecting the Test Test Type Field Data Replicator menu command 2 Load the desired test 3 Click the Settings button on the Toolbar 4 Click the Edi...

Page 54: ...s configuration tab Figure Input terminals on the rear of the VibrationVIEW IO box Each input can be assigned to any function If multiple inputs are defined to the same function all inputs must be true to trigger the function Available Input Functions Disabled No input functions Program Start Stop Start the program when input transitions true Stop program when input transitions false Program Stop ...

Page 55: ...rs are sufficient Additional Monitor Functions Armature Current Monitor amplifier armature current Armature Voltage Monitor amplifier armature voltage Field Current Monitor amplifier field current Field Voltage Monitor amplifier field voltage User Analog Monitor any arbitrary dc voltage signal Inputs can be forced to use Negative True logic Negative true logic is inverted logic where the input mus...

Page 56: ... a 0 and 1 indicate TTL voltage levels of 0 volts and 5 volts respectively threshold level is 2 2 volts For each test number listed in the table below there is a corresponding line in the Remote Input configuration dialog box configuring the name of the test to load BCD 8 s BCD 4 s BCD 2 s BCD 1 s Test number 0 0 0 0 0 0 0 0 1 1 0 0 1 0 2 0 0 1 1 3 0 1 0 0 4 0 1 0 1 5 0 1 1 0 6 0 1 1 1 7 1 0 0 0 8...

Page 57: ...s are inverted so they sink the output to ground when active To configure discrete output 7 for high current open collector outputs set the HDR12 jumpers to A1 A2 and B1 B2 To configure discrete output 8 for high current open collector outputs set the HDR13 jumpers to A1 A2 and B1 B2 To configure discrete output 7 as a TTL output set the HDR12 jumpers to A1 B1 and A2 B2 To configure discrete outpu...

Page 58: ...d HDR13 shown in Open Collector output position NOTE ONLY outputs 7 and 8 can be configured for Open Collector and ONLY when the hardware is configured for Open Collector outputs Failure to properly set the jumpers before using the outputs can result in damage to the hardware Example Remote IO Wiring ...

Page 59: ...22 G4PB16T provides isolation for all 8 inputs and outputs G4 modules can be plugged into the rack to interface AC or DC field circuits An Opto 22 G4PB4 provides isolation for any 4 inputs and or outputs G4 modules can be plugged into the rack to interface AC or DC field circuits ...

Page 60: ...lation and capability of switching 10Amps high voltage AC Inputs shown using internal 5 Volt supply Note pulldown resistors are required 2 7 2 How to use Remote Inputs to monitor your process How to use Remote Inputs to monitor your process This tab is accessed by selecting the Configuration Remote Inputs menu command 96 ...

Page 61: ...ed the remote input option you may ignore this configuration tab Figure Input terminals on the rear of the VibrationVIEW IO box Each input can be assigned to any function Available Monitor Functions Armature Current Monitor amplifier armature current Armature Voltage Monitor amplifier armature voltage Field Current Monitor amplifier field current Field Voltage Monitor amplifier field voltage User ...

Page 62: ...ved with the test data and can be plotted over time Each process value also has optional limits which will abort the test when exceeded A maximum of 16 process variables can be logged with an additional 16 abort monitor channels available Press the More button to configure the monitor channel The analog channel can be configured to scale an external transducer Scale the transducer input to enginee...

Page 63: ...trol To register the type library you can use regtlib exe as follows From the Windows taskbar go to Start Run Type the following in the dialog box that appears regtlib C Program Files VibrationVIEW4 VibrationVIEW tlb Using the ActiveX interface to VibrationVIEW There are three interfaces to VibrationVIEW Each must be created separately if both data retrieval and control functionality are required ...

Page 64: ...or Raw Data Vector Array VectorUnit Get Units for Raw Data VibrationVIEWLib IVibrationVIEWControl AbortEdit Abort edit previously started with Edit Test Activate Activate VibrationVIEW EditTest filename Edit specified test file GetErrorString eString ecode Get error string related to errorcode Not supported from VBA Maximize Maximize VibrationVIEW window Minimize Minimize VibrationVIEW window Rest...

Page 65: ...4 14 VV_WAVEFORM15 15 VV_WAVEFORM16 16 VV_WAVEFORMDEMAND 90 VV_WAVEFORMCONTROL 91 VV_WAVEFORMDEMAND2 92 VV_WAVEFORMCONTROL2 93 VV_WAVEFORMDEMAND3 94 VV_WAVEFORMCONTROL3 95 VV_WAVEFORMDEMAND4 96 VV_WAVEFORMCONTROL4 97 VV_FREQUENCYAXIS 100 VV_FREQUENCY1 101 VV_FREQUENCY2 102 VV_FREQUENCY3 103 VV_FREQUENCY4 104 VV_FREQUENCY5 105 VV_FREQUENCY6 106 VV_FREQUENCY7 107 VV_FREQUENCY8 108 VV_FREQUENCY9 109 ...

Page 66: ...NVERSION_FAILED 0x0208 Could not convert a string to the system output format VVIEW_E_NO_DATA 0x0209 No live data is available VVIEW_S_SHORTER_THAN_REQUESTED 0x020a End of array could not be filled as requested data set is smaller than the allocated return array VVIEW_E_WAITING_FOR_BOX 0x020b Waiting for IOBox to initialize could not complete requested action VVIEW_E_ACTIVEX_KEYMISSING 0x020c The ...

Page 67: ...brationVIEW VibrationVIEW will now monitor the file C Program Files VibrationVIEW4 RemoteControl txt VibrationVIEW will report status in a new file C Program Files VibrationVIEW4 RemoteControl Status To remotely control VibrationVIEW you can write the following commands to this RemoteControl txt load FileName This command will load test profile specified with fully qualified path FileName run Run ...

Page 68: ... data can be placed in the file using a parameter field TEDS channel name where the square brackets indicate the beginning and ending of the field and the first 5 characters of the field are TEDS in all uppercase letters The channel selects the input channel to read The name selects which parameter to insert the available parameters depend on the model of accelerometer Graphs Graphs can be placed ...

Page 69: ...hich can be displayed by Internet Explorer A typical html form file contains a single form with controls for text entry The text can be automatically inserted into the test report With a form the data entry can occur during test setup and the appropriate report run at the end of the test An HTML form is a section of a document containing normal content markup special elements called controls check...

Page 70: ...ierGainUp will fill in with Amplifier Is Gain Up if checked input type checkbox name AmplifierGainUp value Amplifier Is Gain Up Set the Amplifier gain to 50 br p p FORM Customer will fill in with entered text Enter Customer Name input type text name Customer size 25 br FORM Job will fill in with entered text Enter Job Name input type text name Job size 25 br FORM Technician will fill in with selec...

Page 71: ...requency Ch1 PARAM Ch1Accel Control PARAM CtrlAccel Ch2 PARAM Ch2Accel Control Vel PARAM CtrlVel Ch3 PARAM Ch3Accel Control Disp PARAM CtrlDisp Ch4 PARAM Ch4Accel Drive voltage PARAM OutputRMS System gain is PARAM SystemGain Max system gain limit PARAM RunMaxSystemGain Accelerometer calibration details Ch1 PARAM mVg1 PARAM Cal1 Ch2 PARAM mVg2 PARAM Cal2 Ch3 PARAM mVg3 PARAM Cal3 Ch4 PARAM mVg4 PAR...

Page 72: ...cel PARAM ch18Name PARAM Ch18Accel PARAM ch19Name PARAM Ch19Accel PARAM ch20Name PARAM Ch20Accel PARAM ch21Name PARAM Ch21Accel PARAM ch22Name PARAM Ch22Accel PARAM ch23Name PARAM Ch23Accel PARAM ch24Name PARAM Ch24Accel PARAM ch25Name PARAM Ch25Accel PARAM ch26Name PARAM Ch26Accel PARAM ch27Name PARAM Ch27Accel PARAM ch28Name PARAM Ch28Accel PARAM ch29Name PARAM Ch29Accel PARAM ch30Name PARAM Ch3...

Page 73: ...ARAM Ch9Disp PARAM ch10Name PARAM Ch10Disp PARAM ch11Name PARAM Ch11Disp PARAM ch12Name PARAM Ch12Disp PARAM ch13Name PARAM Ch13Disp PARAM ch14Name PARAM Ch14Disp PARAM ch15Name PARAM Ch15Disp PARAM ch16Name PARAM Ch16Disp PARAM ch17Name PARAM Ch17Disp PARAM ch18Name PARAM Ch18Disp PARAM ch19Name PARAM Ch19Disp PARAM ch20Name PARAM Ch20Disp PARAM ch21Name PARAM Ch21Disp PARAM ch22Name PARAM Ch22Di...

Page 74: ...5Name 26 PARAM Ch26Name 27 PARAM Ch27Name 28 PARAM Ch28Name 29 PARAM Ch29Name 30 PARAM Ch30Name 31 PARAM Ch31Name 32 PARAM Ch32Name mV G sensitivity PARAM ch1Name PARAM mVg1 PARAM ch2Name PARAM mVg2 PARAM ch3Name PARAM mVg3 PARAM ch4Name PARAM mVg4 PARAM ch5Name PARAM mVg5 PARAM ch6Name PARAM mVg6 PARAM ch7Name PARAM mVg7 PARAM ch8Name PARAM mVg8 PARAM ch9Name PARAM mVg9 PARAM ch10Name PARAM mVg10...

Page 75: ...ARAM Cal13 PARAM ch14Name PARAM Cal14 PARAM ch15Name PARAM Cal15 PARAM ch16Name PARAM Cal16 PARAM ch17Name PARAM Cal17 PARAM ch18Name PARAM Cal18 PARAM ch19Name PARAM Cal19 PARAM ch20Name PARAM Cal20 PARAM ch21Name PARAM Cal21 PARAM ch22Name PARAM Cal22 PARAM ch23Name PARAM Cal23 PARAM ch24Name PARAM Cal24 PARAM ch25Name PARAM Cal25 PARAM ch26Name PARAM Cal26 PARAM ch27Name PARAM Cal27 PARAM ch28N...

Page 76: ...AM ch2acp PARAM ch3Name PARAM ch3acp PARAM ch4Name PARAM ch4acp PARAM ch5Name PARAM ch5acp PARAM ch6Name PARAM ch6acp PARAM ch7Name PARAM ch7acp PARAM ch8Name PARAM ch8acp PARAM ch9Name PARAM ch9acp PARAM ch10Name PARAM ch10acp PARAM ch11Name PARAM ch11acp PARAM ch12Name PARAM ch12acp PARAM ch13Name PARAM ch13acp PARAM ch14Name PARAM ch14acp PARAM ch15Name PARAM ch15acp PARAM ch16Name PARAM ch16ac...

Page 77: ...me PARAM ch26differential PARAM ch27Name PARAM ch27differential PARAM ch28Name PARAM ch28differential PARAM ch29Name PARAM ch29differential PARAM ch30Name PARAM ch30differential PARAM ch31Name PARAM ch31differential PARAM ch32Name PARAM ch32differential Input Capacitor Coupling PARAM ch1Name PARAM ch1coupling PARAM ch2Name PARAM ch2coupling PARAM ch3Name PARAM ch3coupling PARAM ch4Name PARAM ch4co...

Page 78: ...tal System Limits Model PARAM LimitsShakerModel Force PARAM LimitsForce Velocity PARAM LimitsVelocity Displacement PARAM LimitsDisplacement Acceleration PARAM LimitsAcceleration 2 8 4 Sine report parameter names Sine report parameter names Values defining the test profile and controller parameters Plus Abort PARAM Abort Minus Abort PARAM Abort Plus Tolerance PARAM Tol Minus Tolerance PARAM Tol Dat...

Page 79: ...ARAM Extremal Extremal acceleration limits PARAM MaxA1 PARAM MaxA2 PARAM MaxA3 PARAM MaxA4 PARAM MaxA5 PARAM MaxA6 PARAM MaxA7 PARAM MaxA8 PARAM MaxA9 PARAM MaxA10 PARAM MaxA11 PARAM MaxA12 PARAM MaxA13 PARAM MaxA14 PARAM MaxA15 PARAM MaxA16 Extremal velocity limits PARAM MaxV1 PARAM MaxV2 PARAM MaxV3 PARAM MaxV4 PARAM MaxV5 PARAM MaxV6 PARAM MaxV7 PARAM MaxV8 PARAM MaxV9 PARAM MaxV10 PARAM MaxV11...

Page 80: ... Ch11MomentArm PARAM Ch12MomentArm PARAM Ch13MomentArm PARAM Ch14MomentArm PARAM Ch15MomentArm PARAM Ch16MomentArm Annotation line 1 PARAM Note1 Annotation line 2 PARAM Note2 Annotation line 3 PARAM Note3 Data directory PARAM DataDirectory Data storage settings PARAM DataStorage Segment table PARAM SegmentTable table format Start Frequency Start Amplitude End Frequency End Amplitude Schedule table...

Page 81: ...RAM Ch13Accel PARAM Ch14Accel PARAM Ch15Accel PARAM Ch16Accel Channel velocity PARAM Ch1Vel PARAM Ch2Vel PARAM Ch3Vel PARAM Ch4Vel PARAM Ch5Vel PARAM Ch6Vel PARAM Ch7Vel PARAM Ch8Vel PARAM Ch9Vel PARAM Ch10Vel PARAM Ch11Vel PARAM Ch12Vel PARAM Ch13Vel PARAM Ch14Vel PARAM Ch15Vel PARAM Ch16Vel Channel displacement PARAM Ch1Disp PARAM Ch2Disp PARAM Ch3Disp PARAM Ch4Disp PARAM Ch5Disp PARAM Ch6Disp P...

Page 82: ...it9 PARAM Unit10 PARAM Unit11 PARAM Unit12 PARAM Unit13 PARAM Unit14 PARAM Unit15 PARAM Unit16 Accelerometer calibration details Channel name PARAM Ch1Name PARAM Ch2Name PARAM Ch3Name PARAM Ch4Name PARAM Ch5Name PARAM Ch6Name PARAM Ch7Name PARAM Ch8Name PARAM Ch9Name PARAM Ch10Name PARAM Ch11Name PARAM Ch12Name PARAM Ch13Name PARAM Ch14Name PARAM Ch15Name PARAM Ch16Name mV G sensitivity PARAM mVg1...

Page 83: ...ARAM SampleFrequency Control channels PARAM Channels Channel combination method PARAM Combine Sigma clipping PARAM SigmaClipping Control lines PARAM Lines Max outlier percent PARAM MaxOutlierPercent Max drive voltage PARAM MaxDrive Start control gain PARAM StartControlGain Start averaging PARAM StartAveraging Start max system gain PARAM StartMaxSystemGain Start threshold volts PARAM ThresholdVolta...

Page 84: ...d drive PARAM MemorizedDrive Current modifier PARAM Modifier Time running PARAM RunTime Level duration PARAM LevelDuration Time on this level PARAM LevelTime Schedule looping count PARAM LoopCount Output drive voltage PARAM OutputRMS Control measurement PARAM Control Control displacement PARAM CtrlDisp Current system gain PARAM SystemGain Full band RMS measurements PARAM Ch1 PARAM Ch2 PARAM Ch3 PA...

Page 85: ...ARAM Unit11 PARAM Unit12 PARAM Unit13 PARAM Unit14 PARAM Unit15 PARAM Unit16 Accelerometer calibration details Channel name PARAM Ch1Name PARAM Ch2Name PARAM Ch3Name PARAM Ch4Name PARAM Ch5Name PARAM Ch6Name PARAM Ch7Name PARAM Ch8Name PARAM Ch9Name PARAM Ch10Name PARAM Ch11Name PARAM Ch12Name PARAM Ch13Name PARAM Ch14Name PARAM Ch15Name PARAM Ch16Name mV G sensitivity PARAM mVg1 PARAM mVg2 PARAM ...

Page 86: ...ARAM Inverted Control Gain PARAM Gain System Lag PARAM Lag Max Frequency PARAM MaxFrequency Sample rate PARAM SampleFrequency Pulse Amplitude PARAM Demand Pre Pulse PARAM PrePulse Post Pulse PARAM PostPulse Pulse Width PARAM Width Pulse Polarity PARAM Polarity Pulse Type PARAM Type MilStd limits PARAM MilLimits File name PARAM FileName Test profile name PARAM TestName Annotation line 1 PARAM Note1...

Page 87: ...ment units PARAM UnitDisplacement Spectral density units PARAM UnitDensity Accelerometer calibration details Channel name PARAM Ch1Name PARAM Ch2Name PARAM Ch16Name mV G sensitivity PARAM mVg1 PARAM mVg2 PARAM mVg16 Calibration data PARAM Cal1 PARAM Cal2 PARAM Cal16 2 8 7 Field Data Replicator report parameter names Field Data Replicator report parameter names Values defining the test limits Max o...

Page 88: ...requency Analysis Window Type PARAM Window Analysis Lines PARAM Lines Annotation line 1 PARAM Note1 Annotation line 2 PARAM Note2 Annotation line 3 PARAM Note3 Data directory PARAM DataDirectory Data storage PARAM DataStorage Schedule table PARAM ScheduleTable Schedule table with dig outputs PARAM DigitalOutputTable Note For Loop declaration using multiple loop control add the number of the contro...

Page 89: ...ails Channel name PARAM Ch1Name PARAM Ch2Name PARAM Ch3Name PARAM Ch4Name PARAM Ch5Name PARAM Ch6Name PARAM Ch7Name PARAM Ch8Name PARAM Ch9Name PARAM Ch10Name PARAM Ch11Name PARAM Ch12Name PARAM Ch13Name PARAM Ch14Name PARAM Ch15Name PARAM Ch16Name mV G sensitivity PARAM mVg1 PARAM mVg2 PARAM mVg3 PARAM mVg4 PARAM mVg5 PARAM mVg6 PARAM mVg7 PARAM mVg8 PARAM mVg9 PARAM mVg10 PARAM mVg11 PARAM mVg12...

Page 90: ... Sensitivity direction x y z TEDS Direction Measure position ID TEDS MessID User data ascii TEDS User Reference temperature T ref TEDS RefTemp Channel 2 Manufacturer TEDS 2 Manufacturer Model number TEDS 2 Model Version letter TEDS 2 Ver_let Version number TEDS 2 Ver_no Serial no TEDS 2 Serial Calibration date TEDS 2 CalDate Sensitivity Fref TEDS 2 Sens Ref Fref Frequency TEDS 2 Reffreq Phase inve...

Page 91: ...splacement vs frequency GRAPH Drive Drive signal vs frequency GRAPH Phase Control and or Ch2 Ch1 Phase vs frequency GRAPH Xmiss Transmissibility ChX ChY vs frequency GRAPH SystemGain System Gain Output voltage Input Acceleration GRAPH t_Accel Acceleration time history GRAPH t_Vel Velocity time history GRAPH t_Disp Displacement time history GRAPH t_Drive Drive signal time history GRAPH t_Phase Cont...

Page 92: ...inimum value on the X axis to 10 0 XMax100 0 Force the maximum value on the X axis to 100 0 YMin10 0 Force the minimum value on the Y axis to 10 0 YMax100 0 Force the maximum value on the Y axis to 100 0 Example GRAPH Accel Ch1 Ch2 LogX LogY BW 2 8 10 Random report graph types Random report graph types Graph types for Random reports may be one of the following GRAPH Accel Acceleration vs frequency...

Page 93: ...W150 Select graph width in mm default is 150 H100 select graph height in mm default is 100 LogX Use a logarithmic horizontal axis default is linear LogY Use a logarithmic vertical axis default is linear BW Create a black and white plot default is color ActiveLines Display only the frequency range being controlled XMin10 0 Force the minimum value on the X axis to 10 0 XMax100 0 Force the maximum va...

Page 94: ...t is 100 LogX Use a logarithmic horizontal axis default is linear LogY Use a logarithmic vertical axis default is linear BW Create a black and white plot default is color Full Plot the full time duration including pre and post pulse compensation XMin10 0 Force the minimum value on the X axis to 10 0 XMax100 0 Force the maximum value on the X axis to 100 0 YMin10 0 Force the minimum value on the Y ...

Page 95: ...3 Channel 13 Ch14 Channel 14 Ch15 Channel 15 Ch16 Channel 16 Note For Loop declaration using multiple loop control add the number of the control loop you want graphed Example GRAPH xxx nn where nn is the control loop Note For Transmissibility graphs the first channel listed is the numerator and the last is the denominator Flags that may be applied to set the formatting of the graph W150 select gra...

Page 96: ...Menu commands Part III ...

Page 97: ...iles command File menu This command opens a pop up sub menu with a list of the 10 most recently used tests To open one of the tests listed click on it 3 2 3 Save Data File Save Data File command File menu Use this command to store the active data set to a file that may then be loaded back into VibrationVIEW using the File Open Data File menu command for viewing and printing This command will bring...

Page 98: ...e The live data stored in the file is the data that is displayed when the Save button is pressed in the Save As dialog box If you want to save a particular set of data for example a transient occurrence in an FDR playback file click the Save button as soon as you see the data appear in the graphs This data may then be loaded again for analysis In this way the Save Data command may be used as a for...

Page 99: ...ommand will bring up a Save As dialog box with Save As type options of Matlab Files mat Note The File Save As Matlab command is an export only function All data is exported If you wish to use the data with VibrationVIEW use the File Save As VibrationVIEW Data menu command instead 3 2 4 6 Meta File Save As Meta File command File Menu Use this command to save the currently selected graph to a file u...

Page 100: ...e This command is available only when a graph of a stored data file is active This command along with the Next Data menu command is useful for quickly scanning through a set of data files in a directory in chronological order Shortcuts Keys Left arrow Down arrow Keypad Minus Hint To see multiple types of graphs of each data file select the Window New menu command and the Window Tile menu command t...

Page 101: ...Save As Report Document File menu command choose a template decide where to store the report and under what name and click the OK button See Also How to create customized reports Shortcuts Toolbar Menus File Save as Report Document File 3 2 9 Quick Report Quick Report File Menu This command will save a document with a variety of useful information and graphs The information saved depends on the se...

Page 102: ...Menu This command will create a report using the same templates that the Create Report Command uses but instead of storing it the report will be sent to the e mail recipient s you specify To Email a report select the File Email Report menu command choose a template and click the OK button then select recipient See Also How to create customized reports 3 2 12 Print Active Graph Print Active Graph c...

Page 103: ... want to use Select the Default Printer or select a specific printer from the drop down list You can install printers and configure ports using the Windows Control Panel Properties Displays a dialog box where you can make additional choices about printing specific to the type of printer you have selected Paper Size Select the size of the paper on which the document is to be printed Paper Source So...

Page 104: ...ked Upper Left Corner X and Y position of the left upper corner of the page relative to the paper sheet width A Left value of 0 0 indicates that the page will be printed starting at the left side of the paper sheet A Top value of 0 0 indicates that the page will be printed starting at the top side of the paper sheet This parameter is only used if the Exact Size printing style is selected Print gra...

Page 105: ... a Windows Explorer window and take you directly to the VibrationVIEW Profiles directory to allow you to copy move rename files 3 2 19 Exit Exit command File menu Use this command to end your VibrationVIEW session You can also use the Close command on the application system menu Shortcuts Mouse Click the X in the upper right corner of the VibrationVIEW window or double click the application s syst...

Page 106: ...lerometers Check the Accel power source button to enable the accelerometer power source built into the VibrationVIEW I O box Check the Use alternate unit checkbox if your accelerometer ratings are listed in some other unit To verify that the system is operating properly and that the accelerometer sensitivity settings along with the other system parameters are correct follow the procedure found und...

Page 107: ...isplacement Force Mass and Acceleration Spectral Density If the listed units are not appropriate for your test custom units may be defined by entering a label in the upper box between the 1 and the and the appropriate scaling factor from the standard international unit in the lower box For example 1 oz 0 02835 kg 3 3 3 System Limits System Limits command Configuration menu This command opens the S...

Page 108: ...t you are about to run is within the specifications of your shaker system The acceleration and velocity limits are measured 0 to peak while displacement limits are measured peak to peak Note The System Mass parameters are used to compute the acceleration rating limits 3 3 4 System Mass System Mass command Configuration menu This command opens the System Mass tab on the VibrationVIEW Configuration ...

Page 109: ...junction with the System Limits to determine whether your tests can be run within the specifications of your shaker system The units used for the masses are selected under the System Units tab 3 3 5 Remote Inputs Remote Inputs command Configuration menu This command opens the Remote Inputs tab on the VibrationVIEW Configuration dialog box Selecting Configuration Remote Inputs menu command displays...

Page 110: ...d output options Remote inputs functions standard on all VibrationVIEW Disabled Input is disabled and does nothing Emergency Stop Button Normally Closed Input will shutdown the test at the programmed abort rate Typically used to wire a normally closed Emergency Stop Pushbutton Optional Remote Input functions that can be added to VibrationVIEW ...

Page 111: ...CD specified profile when the input goes true Resume Restart a stopped profile without resetting the schedule timer Record Start Stop Start the recorder when the input goes true stop when input goes false Shaker Operate Button Run the shaker startup sequence when the input goes true and reset any powersaver timers Shaker Running Status Interlock the controller so that run in not available unless t...

Page 112: ...est is running Sweep Holding Output is on during sine test while holding sweep on a frequency Sweeping Down Output is on during sine test while sweeping from lower frequencies to higher frequencies Sweeping Up Output is on during sine test while sweeping from higher frequencies to lower frequencies Brake control Special application output for TEAM 901 controllers Shaker Power Output can be used to...

Page 113: ...ith any Email client To configure the E Mail Notification complete the following steps 1 Enter your SMTP Server into the form Your SMTP Server name can often be determined from your Email client configuration Outlook or similar If you are not sure what SMTP server to use enter your Email address in the Send message to field then click on the SMTP Server button This should automatically find the se...

Page 114: ...ill send e mail every time a test is stopped Send status e mail on abort errors will send an e mail every time a test aborts Send status e mail on schedule level changes will send an e mail each time the level in the test schedule changes Send status Email every n minutes while a test is running will send an e mail every n minutes to keep you updated on test status continually Select Message deliv...

Page 115: ... the box labeled Allow access to stored data This allows remote access of stored data from previous tests run on this machine Fill in the field labeled Username and Password to restrict access to stored data If these fields are left blank your web client will allow anyone to access the stored data To allow web access for starting and stopping of tests on this machine check the box labeled Allow re...

Page 116: ...d if all is configured properly display the Web interface This is also the address you use on any remote machines to access this machine remotely Check the box labeled Log accesses to file and specify a log file if you need debugging information The logfile will contain a log of all the remote access attempts 3 3 8 Parameters Parameters command Configuration menu This command opens the Parameters ...

Page 117: ...d to assist finding resonances The max test tabs controls the number of test which can be loaded at any given time When the maximum is reached the oldest test profile will be unloaded You can set the maximum to 1 test tab to disable the test tab feature The profile graph can be displayed above below or to the right of the test profile entry dialog The Shaker Powersave Timer is displayed if any rem...

Page 118: ...tion through a PC sound card and speakers and can be used to evaluate or demonstrate the software without using a VR8500 unit File Viewer mode is used for viewing and post processing data files on a computer without an 8500 unit connected and is sold as a separate software option Control Box Addresses are used to assign IP address to the VR8500 s attached to this computer The VR8500 attached to th...

Page 119: ...gging for technical support use Network Logging allows the Vibration Research technical support team to better diagnose communication issues you may have between your VR8500 I O box and your computer This option will maintain a text log file socket log in the application directory The additional information stored in this file can be usefule to Vibration Research support personnel in diagnosing co...

Page 120: ... rights reserved 3 3 11 Verification Verification command Configuration menu This command opens the System Verification tab on the VibrationVIEW Configuration box See Also How to verify calibration 3 3 12 Graph Defaults Graph Settings Command Configuration menu 107 297 ...

Page 121: ...cond 3 4 Test menu 3 4 1 Test Type 3 4 1 1 Select Test Type Select Test Type command Test menu Use this command to select the type of test you will be running The VibrationVIEWTest Type dialog box will appear The different test types are software options that are protected by a hardware key If your hardware key does not have an option enabled you will still be able to switch to that mode define pr...

Page 122: ...est mode 3 4 2 Switch Test Profile Switch Test Profile Test menu Shows all open profiles 3 4 3 Recent Test Profiles Recent Test Profiles Test menu Displays a list of the most recent test profiles used List is saved on exit 3 4 4 Define New Test Define New Test command Test menu Use this command to have the program guide you through a series of dialog boxes to define a new test All values are initi...

Page 123: ... Settings dialog boxes will be opened Sine Test Settings Random Test Settings Shock Test Settings Data Replay Test Settings Shortcuts Toolbar 3 4 6 Open Test Profile Open Test Profile command Test menu Use this command to open any previously defined and saved test profile Extract Profile From Data To restore a profile from a VibrationVIEW data file Use Test Open Test Profile Set Files of type to E...

Page 124: ... Once this default is saved and New Test is chosen these saved settings will become the default values in the Settings dialog box This will give you the opportunity to start with values that might be similar to all tests of a particular profile type Each Test Type can have its own default settings If you have saved New Test Defaults but no longer wish to use them you may revert back to the default...

Page 125: ...the Test Schedule dialog box to add the tests to the test sequence The tests will be run in the defined order with each test running for the duration specified within the individual test s schedule There will be a pause of approximately 5 seconds between each test The schedule will be aborted if a test is shut down prior to completion of the schedule For example if the operator presses the Stop bu...

Page 126: ...s are fixed The program will ask you if you want to save the new drive signal to the disk or use it for the current session only reverting to the original settings the next time this test is opened Generally you would want to click the Yes button to permanently save this drive signal with the test Procedure for using Memorized Drives 1 Disable memorized drive for the test edit the test click the S...

Page 127: ...to the test s memorized drive signal It will also enable the Enable memorized drive check box 7 The next time you run this test it will start running with the drive signal created from the standard drive file Notes To switch back to starting the test from a low level signal and equalizing the system on startup i e disable the memorized drive function remove the check mark next to the Enable memori...

Page 128: ...Record menu Edit command launches the optional Adobe Audition file editor if this software package has been installed The most recently recorded file will be loaded into the editor Shortcuts Controls 3 5 5 Record Data Settings command Record Data Settings command Record menu Settings command displays the Record Settings dialog box This allows channel selection as well as selection of the default r...

Page 129: ...w graph in VibrationVIEW A dialog box will prompt you with the types of graphs available For more information on the graph dialog boxes and graph types for the various tests see System Check Graph Settings dialog box Sine Graph Settings dialog box Random Graph Settings dialog box Shock Graph Settings dialog box Field Data Replicator Graph Settings dialog box Shortcuts 257 259 264 265 267 ...

Page 130: ...is command to open the Graph Settings dialog box appropriate for the currently selected graph You may then modify the type of graph the traces displayed on the graph and the axis settings Click the OK button to have the graph rebuilt with these new settings Shortcuts Toolbar Keys Ctrl G See Also System Check Graph Settings dialog box Sine Graph Settings dialog box Random Graph Settings dialog box ...

Page 131: ...the right mouse button See Also Y Axis Autoscale 3 6 6 Autoscale All Graphs Autoscale All Graphs command Graph menu Use this command to automatically set both horizontal and vertical axis scales of all graphs so that the traces fit on the screen Shortcuts Keys Ctrl Q See Also Y Axis Autoscale Full Autoscale 3 6 7 Save Graph Layout Save Graph Layout command Graph menu Use this command to save the g...

Page 132: ...ine Data Storage settings Use this command to clear the retained time history data for Random and Field Data Replicator time history graphs 3 7 Cursor menu 3 7 1 Cursor Window Cursor Window command Cursor menu View Menu Use this command to show or hide the Cursor Display box that shows the values for the graph traces at the current cursor position Holding down the Shift key while moving the cursor...

Page 133: ...7 4 Prev Differential Cursor Previous Differential Cursor command Cursor menu Use this command to cycle the dual cursor to the previous cursor mode The cursor modes are Standard Cursor Display a window with the data at the current cursor location Delta Cursor Display the difference between two cursors Slope Cursor Display rate of change between two cursors Minimum Cursor Display minimum value betw...

Page 134: ...ay a vertical cursor bar to help with the selection of an insertion point turn on the cursor display using the Graph Cursor Display menu command Tips To accurately place an annotation first use the right mouse button click drag release to zoom in on the region of interest Add the annotation by positioning the cursor and pressing the Insert key Zoom out by double clicking the right mouse button To ...

Page 135: ...nnotation by pointing to the annotation text with the mouse clicking the left mouse button holding that button down while moving the mouse cursor to the desired location and releasing the button to complete the move See Also Add Annotation Remove Annotation Shortcuts Mouse Click and drag the annotation Keys F4 3 7 15 Remove Annotation Remove Annotation command Cursor menu Use this command to remov...

Page 136: ...ps command View menu Use this command to enable or disable the displaying of tool tips in the toolbar and the Control Centers A tool tip is a small window that displays context sensitive help information when you move the mouse cursor over a button on the toolbar A check mark appears next to this menu item when tool tips are enabled 3 8 5 Tool Bar Text Tool Bar Text command View menu Use this comm...

Page 137: ...8 10 Cursor Window Cursor Window command Cursor menu View Menu Use this command to show or hide the Cursor Display box that shows the values for the graph traces at the current cursor position Holding down the Shift key while moving the cursor with the mouse snaps the cursor to the nearest peak Holding down the Ctrl key while moving the cursor with the mouse snaps the cursor to the nearest valley ...

Page 138: ...Window menu Use this command to open a new window with the same data as the active window You can open multiple document windows to display different views of a data set at the same time If you change the contents in one window all other windows based on the same data set reflect those changes When you open a new window it becomes the active window and is displayed on top of all other open windows...

Page 139: ...of Help From the opening screen you can jump to step by step instructions for using VibrationVIEW and various types of reference information Once you open Help you can click the Contents button to return to the opening screen Shortcut Toolbar Keys F1 3 10 2 Contents and Index Contents and Index command Help menu Use this command to open the help file s table of contents index and search functions ...

Page 140: ...st the helpfile information on the stop code for the listed test System Info Specifies information on your computer system and what programs are running on it Microsoft System Information MSInfo is a component of the Microsoft Operating System and also included with Microsoft Office This allows you to conveniently save a diagnostic file for Vibration Research support technicians Cancel Close this ...

Page 141: ...e Help About VibrationView menu to apply the key update 3 10 8 Register Hardware Register Hardware Help Menu Connect to Vibration Research through the internet and register your hardware To use this option you must be currently connected to the internet 3 10 9 About Vibration View About VibrationVIEW command Help menu Use this command to display the copyright notice and version number of Vibration...

Page 142: ...Test Definition Part IV ...

Page 143: ...est Definition dialogs Sine Test Definition Random Test Definition Classical Shock Test Definition Field Data Replicator Test Definition 4 2 Sine Test Definition 4 2 1 Profile tab Sine Test Settings dialog box Selecting the Test Edit Test Settings menu command while a Sine test is open displays this dialog box 130 149 171 189 110 ...

Page 144: ...meter selected for the Start Amplitude defines what type of control to use for each level For example if in inches is selected displacement will be controlled if in sec is selected velocity will be controlled or if G is selected acceleration will be controlled Therefore if you need a constant displacement section set the units selection to a displacement unit e g in If the frequency sweep is linea...

Page 145: ...ration velocity and displacement requirements for the test These boxes will be highlighted in red if the test exceeds the System Limits and in yellow if the test is within 5 of the system limits The tabs along the top of the dialog box are used to select the following parameter entry screens Profile Enter the frequency and amplitude breakpoints Schedule Set test duration and amplitude scaling leve...

Page 146: ...cy at which the sweep will begin whether it will start sweeping up or down from this value and the rate at which the sweep will run To enter a fixed frequency test define one or more levels at fixed frequencies using the Modifier type for example the third segment in the dialog box shown above will run 10 Cycles at 0 1 in pk pk at a fixed frequency of 30 Hz The Sweeps parameter defines how many sw...

Page 147: ...k at Fixed Use the specified velocity amplitude 0 to peak at the specified frequency Disp pk pk at Fixed Use the specified displacement amplitude peak to peak at the specified frequency Times Repeat part of the test schedule the specified number of times Wait for operator Wait for the operator to press the Continue button to resume the test Resonance Table Automatically detect the Ch2 Ch1 transmis...

Page 148: ...ve a report name when the level is reached The report template that was selected using the Browse button will then open and a copy will also be saved to the hard drive of your system with the name supplied If the View Report function is used a report will open showing the report template selected by the Browse button and a copy of the report will be saved using the standard naming convention of th...

Page 149: ... frequency is defined see the sweep functions below and number of sweeps is selected the controller will calculate how long the test must run to complete the number of cycles sweeps specified Example at 10 Hz fixed frequency test a 1000 sweep test would run for 1000 10 100 seconds 4 2 4 Parameters tab Sine Define Parameters tab Clicking the Parameters tab in the Test Edit Test Settings dialog box ...

Page 150: ...s a good safety precaution because it allows the operator more time to abort the test if he sees that the shaker is moving but the input signals are not registering any acceleration for example when an accelerometer cable is not connected The Response Time and Min Response Time parameters are the primary loop tuning parameters The Response Time parameter defines high frequency loop response Lower ...

Page 151: ...e output decays to zero when the test is stopped The Fractional Bandwidth parameter defines the bandwidth of the tracking filters at low frequencies It is specified as a percentage of frequency The Maximum Bandwidth parameter defines the bandwidth of the tracking filters at high frequencies The Fractional Bandwidth is not allowed to exceed the Maximum Bandwidth The Sample Rate parameter should in ...

Page 152: ...n as brown lines on the graphs The tolerance levels are used to determine when the control switches from startup mode to run mode i e when the frequency sweep begins and the timers begin counting The Abort dB parameters define the number of decibels the abort lines will be above and below the desired acceleration level These lines are typically drawn as red lines on the graphs If the controlled ac...

Page 153: ...0 of the normal start up voltage required The running Max System Gain parameter defines the maximum allowed ratio of output volts to measured acceleration while a test is running Setting this value to a large number e g 100 volts G disables this limit This is a safety limit that restricts the drive output from increasing unless some response is measured on the accelerometer Refer to How to Tune Si...

Page 154: ...nnels Channels may be combined by averaging the amplitudes together standard mode or by using the largest of the selected input channels extremal mode The extremal mode is an optional feature the software key must be programmed to enable it Tracking Filter Note a tracking filter is a filter that extracts only the frequency of interest from the measured signal This is useful for controlling in low ...

Page 155: ...sired acceleration level These abort lines may be enabled individually for each input channel by selecting the Enable check box for the appropriate channel number When one of the monitor channels exceeds these limits and that channel has the abort limits enabled the test will abort You must always have individual channel limits enabled for each channel selected as a control channel Load Input conf...

Page 156: ...n on the toolbar You may also select the directory into which to store the data Click the Copy from test name button to automatically create an output directory based on the name of the current test Check Prompt for Run Name when starting the test to display a prompt dialog allowing the operator to enter a new directory each time the test is started The Hi Lo peak hold values may be automatically ...

Page 157: ...dialog box accesses this dialog box This feature is optional and requires the software key be programmed to enable it Sine Resonance control tracks a resonance frequency by adjusting the driving frequency so that the relative phase between two input channels is 90 degrees 1 57 radians This type of test is usually done with the channel 1 accelerometer mounted on the fixture and the other accelerome...

Page 158: ... is performed There are three options available 1 Curvature computes the normalized second derivative the curvature of the transmissibility curve and selects the N frequencies with the largest curvature values 2 Q Factor computes the Q factor defined as the center frequency divided by the 3dB bandwidth of the peak and selects the N frequencies with the largest Q factors 3 Transmissibility computes...

Page 159: ...test down if for example the product breaks and therefore the resonance frequency changes drastically The limit is defined as both a percentage of the starting frequency or a fixed frequency difference whichever is smaller Recommended values are Feedback Gain 0 01 Max Sweep Rate 0 1x normal rate Max Drift 10 or 100Hz 4 2 9 Notching tab Sine Define Extremal tab Clicking the Notching tab in the Test...

Page 160: ...o keep the input amplitude for that channel below the defined profile Up to 1024 breakpoints can be entered for each channel or the limit can be entered simply as a dB level relative to the demand profile In addition minimum limits may be defined to boost the drive output if a channel is below a defined profile The notching profiles may also be used as spectrum abort limits so that abort limit bre...

Page 161: ...ox to define a stepped frequency instead of continuously swept frequency test This type of test will run at a fixed frequency for the programmed on time Then it will shut down for the programmed off time Next the frequency will step up or down by the amount specified by the Rate Step Size parameter This will continue for the duration of the test stepping with a series of discrete frequency values ...

Page 162: ...e and Step Off Time parameters define how much time to spend at each frequency Click the Enable radio button to turn the step function on or the Disable radio button to turn it off 4 3 Random Test Definition 4 3 1 Table tab Random Test Settings dialog box Selecting the Test Edit Test Settings menu command while a Random test is open displays this dialog box 110 ...

Page 163: ... based on a dB Octave slope value first enter both Frequencies and the known Amplitude Click in the box with the known Amplitude and then in the Slope parameter box The amplitude parameter that will be calculated based on the frequencies and slope will be grayed out while you enter the slope value After entering the Slope parameter press the Tab key and the controller will automatically compute th...

Page 164: ... the actual control level The tabs along the top of the dialog box are used to select the following parameter entry screens Table Enter the frequency and amplitude breakpoints Schedule Set test duration and amplitude scaling level Parameters Enter control loop parameters Limits Enter the safety limits Channels Select control channels and averaging technique Data Store Select automatic data storage...

Page 165: ...ate levels and add looping to repeat level sequences If you have more than 10 levels defined a scroll bar will appear on the right side of the dialog box Use it to scroll through the defined levels The Time parameter defines the duration in the form hours minutes seconds for the indicated level number You can also enter time durations by following the hour value with an h the minute value ...

Page 166: ...was selected using the Browse button will then open and a copy will also be saved to the hard drive of your system with the name supplied If the View Report function is used a report will open showing the report template selected by the Browse button and a copy of the report will be saved using the standard naming convention of the VibrationVIEW software The Save Report As function and the Save Re...

Page 167: ... any other similar tests Note the standard drive signal only needs to be created once as long as the system configuration amplifier gain shaker system etc does not change To disable the use of the memorized drive signal and revert to the slow test start up uncheck the Enable memorized drive box For levels 2 and above the Enable memorized drive check box will enable fast switching of output levels ...

Page 168: ...tics dialog box to define the parameters that influence the Random control loop There are two sets of control parameters The first set starting is used when starting a test to get the output from zero up to the demand level By default the Average is 3 the Gain is 0 1 and the Startup time xx seconds is 15 ...

Page 169: ...rameter defines the frequency resolution of the control loop Increasing the number of lines allows better control of low frequencies and of sharp resonances but makes the controller start and respond more slowly to changing system dynamics The Oversampling parameter allows analysis of frequency response beyond the defined test frequencies A 8 x oversampling will adjust the hardware acquisition sam...

Page 170: ...s defined in test specifications is a minimum number A specification which requires a minimum distribution of 3 sigma typically can be run at any clipping level greater than 3 or with no clipping at all Note Gaussian distributed random noise as used in a random vibration controller typically has many peaks around the 3 sigma level occassional peaks around 4 sigma level and rarely exceeds the 5 sig...

Page 171: ...tion test These safety limits cause the controller to abort a test when it detects an inconsistent measurement for example if an accelerometer falls off during the test The Tol parameters define the maximum minimum spectral density tolerance line levels indicated on the graphs The tolerance lines are shown as dashed brown lines on the graph and are use to ...

Page 172: ...g Max System Gain Measured RMS Acceleration If you start a test without an accelerometer connected these settings will limit the maximum output allowed and the controller will abort the test When an accelerometer is connected the output voltage will be allowed to increase as the measured RMS acceleration level from the accelerometer increases The output threshold parameter is typically 0 005 Volts...

Page 173: ...tion 160 1995 2005 Vibration Research Corporation All rights reserved 4 3 5 Channels tab Random Define Channels tab Clicking the Channels tab on the Test Edit Test Settings dialog box accesses this dialog box 110 ...

Page 174: ...of decibels the monitor channels are allowed to be above or below the desired acceleration level These abort lines may be enabled individually for each input channel by selecting the Enable check box for the appropriate channel number When one of the monitor channels exceeds these limits and that channel has the abort limits enabled the test will abort You must always have individual channel limit...

Page 175: ...save the data automatically at the end of a level as defined on the Schedule tab at the end of a test and or at a regular time interval Check the appropriate boxes to activate the automatic data store function Check Prompt for Run Name when starting the test to display a prompt dialog allowing the operator to enter a new directory each time the test is started 151 285 ...

Page 176: ...aph s settings and checking the Data at Bottom check box in the Random Graph Settings dialog box enables this display All data is saved as a time stamped file that can be viewed at a later time by selecting the File Open Data File menu command 4 3 7 R o R tab Random Define R o R tab Clicking the R o R tab on the Test Edit Test Settings dialog box accesses this dialog box 264 84 110 ...

Page 177: ...fined tones will sweep from the Start Frequency to the End Frequency in the specified number of minutes After the End Frequency is reached the sweep will continue sweeping from the End Frequency back to the Start Frequency To sweep up in frequency set the End Frequency higher than the Start Frequency To sweep down in frequency set the End Frequency lower than the Start Frequency ...

Page 178: ...on All rights reserved The Random on Random control mode is an optional feature the software key must be programmed to enable it 4 3 8 S o R tab Random Define S o R tab Clicking the S o R tab on the Test Edit Test Settings dialog box accesses this dialog box 110 ...

Page 179: ...ects the first Start Frequency The other Start Frequencies follow from the previous End Frequency The Start and End Amplitude parameters set the starting and ending points for each level and do not need to be constant for a given level or continuous at the level endpoints The units selected for the Start Amplitude will determine what type of control is used for that segment ...

Page 180: ...its selection to a displacement unit e g in If the frequency sweep is linear Hz min ramped amplitude sweeps will be straight lines on linear graphs If the frequency sweep is logarithmic ramped amplitude sweeps will be straight lines on log log graphs The frequency can be swept up swept down or held at the start frequency The Sine on Random control mode is an optional feature the software key must ...

Page 181: ...onal and requires the software key be programmed to enable it Random independent channel notching profiles Assign maximum limiting breakpoint profiles to individual channels The drive output will be limited or notched if necessary to keep the input spectrum for that channel below the defined profile Up ...

Page 182: ... may be defined to boost the drive output if a channel is below a defined profile The notching profiles may also be used as spectrum abort limits so that abort limit breakpoint profiles can be assigned to each individual channel and if that channel reaches the defined limit the test will safely shut down 4 3 10 Import tab Random Define Import tab Clicking the Import tab on the Test Edit Test Setti...

Page 183: ...o automatically generate a spectrum profile from input data The input can be a set of frequency amplitude breakpoints a time acceleration history stored in a text file or can be measured from an analog input channel on the VibrationVIEW I O unit To input data from a file perform the following procedure ...

Page 184: ...elect the spectrum generation method Peak hold will keep the peak acceleration level seen at each frequency Average will perform an exponentially weighted average of the input data with the amount of averaging determined by the Average XX frames parameter Higher averaging values will result in more averaging and therefore smoother spectra 3 Select the input channel mV G setting and desired samplin...

Page 185: ...log box to define the type of output pulse The Width parameter defines the duration of the pulse in milliseconds The Polarity parameter defines the direction either positive or negative of the pulse The Type parameter defines the pulse shape Available shapes are Half Sine Initial Peak Terminal ...

Page 186: ...r the pulse If compensation is allowed both prior to and after the pulse the compensation waveforms will be optimized to center the displacement waveform The Convert pulse to SRS button will compute the SRS of the currently selected pulse type and transfer those settings to the SRS tab The tabs along the top of the dialog box are used to select the following parameter entry screens Pulse Select pu...

Page 187: ...ach of a set of output levels You can define up to 200 separate levels plus looping to repeat level sequences multiple times If you have more than 10 levels defined a scroll bar will appear on the right side of the dialog box Use it to scroll through the defined levels The Pulses parameter defines the duration of the level in number of pulses ...

Page 188: ...ame supplied If the View Report function is used a report will open showing the report template selected by the Browse button and a copy of the report will be saved using the standard naming convention of the VibrationVIEW software The Save Report As function and the Save Report function are used to have the software automatically save a report without opening the report for viewing A report templ...

Page 189: ... between the previous level and the current level The system will compute the difference in the desired output levels and scale the drive signal accordingly If Enable memorized drive is not checked for levels 2 and above the transition will be gradual with the transition speed controlled by the Start Gain defined for the test See Also Test Save Current Drive 4 4 3 Parameters tab Shock Define Param...

Page 190: ... shock controller parameters Use this dialog box to define the parameters used by the shock control loop The Feedback Gain parameter defines the rate at which the controller adjusts the drive output and the step size used during the equalization pulses For example with a feedback gain value of 0 3 the 35 ...

Page 191: ... defines the time in seconds between output pulses while the controller is equalizing the system A value of 0 will result in pulses output as fast as the controller can output them The System Lag ms parameter defines the expected lag time delay in the amplifier and shaker system This will adjust the initial timing of the drive pulse and therefore can be used to improve the start up time It will no...

Page 192: ...g box to define critical controller limits for a shock test The Tol parameters define the percentage of peak pulse acceleration at which the controller switches from startup mode to run mode The Abort parameters define the percentage of peak pulse acceleration at which the controller aborts the test ...

Page 193: ...te voltage limit on the output If this voltage is exceeded in either the positive or negative direction the test will abort The Max system gain parameter defines a limit relative to the output The peak output voltage will not be allowed to exceed the peak acceleration value of the input signal multiplied by this system gain value This is a safety limit that will prevent the controller from outputt...

Page 194: ...l s will be used as the control signal When multiple channels are selected the control waveform will be the average of the selected input channels This averaging is done on the time domain signals You can also invert some of the input channels if some of your accelerometers have reversed polarity or must be mounted upside down ...

Page 195: ...hts reserved 4 4 6 Data Storage tab Shock Define Data Storage tab Clicking the Data Storage tab on the Test Edit Test Settings dialog box accesses this dialog box Use this dialog box to define the directory in which you want to store the data files generated by this 110 ...

Page 196: ...k Prompt for Run Name when starting the test to display a prompt dialog box allowing the operator to enter a new directory each time the test is started You can also enter three lines that will appear in the Data Bottom portion of a graph Editing a graph s settings and checking the Data at Bottom check box in the Shock Graph Settings dialog box enables this display All data is saved as time stampe...

Page 197: ...e shape up to 20 000 samples long The input must be a time acceleration history stored as a text file To input a waveform from an ASCII file perform the following procedure 1 Click the Input file button to select the file from which to read the data The file will be scanned and the dialog box will be updated to reflect the contents of the file ...

Page 198: ... the contents of the file into the user defined waveform buffer The program will switch to the Pulse tab Select User defined pulse type and the graph will show the imported waveform Note that the User defined shock pulse feature is an optional feature and requires the software key be programmed to enable it 4 4 8 Breakpoints tab Shock Define Breakpoints tab Clicking the Breakpoints tab on the Test...

Page 199: ...points of the desired Shock Response Spectrum SRS curve To delete a row click a box in the row you want to delete and click the Delete button The Last button will remove all rows after the selected row To use this select the last row you want to keep and press the Last button There will be a prompt to confirm that you want to delete all of the ...

Page 200: ...de breakpoints from a text file You can also enter individual tolerance bands for each frequency in the table If you want to use a single tolerance setting for all frequencies check the Use Tolerances from Limits tab check box and enter the desired tolerance level on the Limits tab 4 4 9 SRS tab Shock Define SRS tab Clicking the SRS tab on the Test Edit Test Settings dialog box accesses this dialo...

Page 201: ...ified SRS curve Note the SRS test method is an optional feature your software key must be programmed to enable it The SRS Analysis parameters define the Damping and Q values used in the SRS calculation and the frequencies at which the SRS analysis is performed The SRS calculations will be performed at the reference frequency and at frequencies with 1 N octave spacing relative to the selected refer...

Page 202: ... The lower frequency should be one tenth of the lowest frequency in the SRS specification and the higher frequency should be double the highest frequency in the SRS specification For burst random the Start Frequency should be equal to or greater than the lowest frequency in the SRS specification and the End Frequency should be equal to or less than the highest frequency in the SRS specification Af...

Page 203: ... button to make a selection of previously recorded data When a file is selected the file s sample rate length acceleration velocity and displacement values will be computed and displayed If any of these values is close to a configured limit it will be displayed in Yellow If any of the values exceeds a configured limit it will be displayed in Red Refer to the ...

Page 204: ... Text File buttons are used to convert waveforms to and from Ascii Text files The Import from FDR File button is used to convert files from FDR Version 2 and 3 VibrationVIEW internal format The following tabs are available Playback Enter the filename of and settings for the playback file Schedule Enter the test duration here Parameters Enter control parameters here Limits Enter the safety limits h...

Page 205: ...box to define how long your test will run You may enter up to 200 levels each of which has an associated amplitude gain modifier level Modifier types are x linear multiple percentage level and dB logarithmic multiple These three types of modifiers are related in the following manner x dB 0 25 25 6 ...

Page 206: ...the report template selected by the Browse button and a copy of the report will be saved using the standard naming convention of the VibrationVIEW software The Save Report As function and the Save Report function are used to have the software automatically save a report without opening the report for viewing A report template must be added to the Schedule Level by clicking on the Browse button and...

Page 207: ...ction parameters These numbers determine how the control algorithm reacts The Lines parameter defines the frequency resolution of the control loop Increasing the number of lines allows better control of low frequencies and of sharp resonances but makes the controller start and respond more slowly to changing system dynamics ...

Page 208: ...um signal to noise ratio required for controlling the spectrum If the desired signal is lower than this ratio above the input noise level the control loop is suspended until the desired signal comes back This prevents control loop updates when the measurements are very noisy relative to the demand signal The Phase response time parameter defines the responsiveness of the phase time control loop Th...

Page 209: ... Acceleration Limits set the maximum RMS level and maximum Peak level allowed on either the control accelerometer or the demand waveform The RMS limit monitors a short time averaged RMS of the signal The Peak limit monitors the sample by sample peak value of the signal If either the control or the demand waveform exceeds one of the configured acceleration limits the test ...

Page 210: ...ulic shaker The Starting Max System Gain parameter depends on the shaker system and the amplifier gain setting To determine this value start the test and after the output reaches the demand amplitude note both the Volts rms and the Demand G RMS readings in the FDR Control Center Set the Starting Max System Gain parameter to approximately Starting Max System Gain 4 x Volts rms Demand G RMS To disab...

Page 211: ...set the frequency range over which the feedback control will operate You can also enable a notch band to filter out a frequency range in the middle of the spectrum This is useful for such things as a shake and rattle test where you can see which frequencies are exciting a rattle mode The notch can be enabled disabled or changed while the controller is running ...

Page 212: ...lp 199 1995 2005 Vibration Research Corporation All rights reserved 4 5 6 Data tab Field Data Replicator Define Data Storage tab Click the Data Storage tab on the Test Edit Test Settings dialog to display this page 110 ...

Page 213: ...hen starting the test to display a prompt dialog box allowing the operator to enter a new directory each time the test is started You can also enter three lines that will appear in the Data Bottom portion of a graph Editing a graph s settings and checking the Data at Bottom check box in the Field Data Replicator Graph Settings dialog box enables this display All data is saved as time stamped files...

Page 214: ...colon or white space delimited data into an FDR format file for use as the playback file in Field Data Replicator tests Select an input file by clicking the Input file button Set the appropriate sampling rate column number and acceleration units Click the Convert File button to convert the file to the VibrationVIEW internal format FDR format ...

Page 215: ...tion 202 1995 2005 Vibration Research Corporation All rights reserved 4 5 8 Record Field Data Replicator Define Record tab Click the Record tab on the Test Edit Test Settings dialog box to display this dialog 110 ...

Page 216: ...extention of the file from vfw to mat The Sample Rate for the newly recorded file can be set in the Sample Rate Box A typical sample rate setting is three to four times the highest frequency you need to reproduce during playback Reducing sample rate will create smaller files and tighter low frequency response when the file is played back Increasing the sample rate will allow you to reproduce highe...

Page 217: ...Control Centers Part V ...

Page 218: ... Center Use this dialog box to check the system operation We recommend that you perform this function as a prelude to any new testing operation This is a good way to verify that the accelerometer amplifier shaker and control system are all functioning To use place a displacement wedge on your shaker table The operation defaults are 0 10 inches at 30 Hz Turn the shaker on Click the Auto button Watc...

Page 219: ...Accel The desired peak acceleration for input channel 1 is entered here This is used when Automatic mode is enabled Velocity The desired peak velocity for input channel 1 is entered here This is used when Automatic mode is enabled Disp The desired peak to peak displacement for input channel 1 is entered here This is used when Automatic mode is enabled System Gain V G This parameter shows the outpu...

Page 220: ...ut frequency at the current value Sweep Down This button causes the frequency sweep to proceed with decreasing frequencies Reset Sine Graph Data This button clears the historical high low last pass data from the graphs Stop Code Info This box displays why the test shut down Click the Info button for more information on the current status of the test See Also Sine Stop Codes Demand This box display...

Page 221: ...ing This box displays how many sweeps are remaining Level Time This box displays how long you have been at the current level Total Time This box displays how much time has elapsed since the test started Current Time This box displays the current date and time Level This box displays the current level at which the test is running Test Name This box displays the name of the test file that you are ru...

Page 222: ...t the item under test Reset Averaging Resets the spectral averaging by clearing the spectral history Stop Code Info This box displays why the test shut down Click the Info button for more information on the current status of the test See Also Random Stop Codes Demand This box displays the expected RMS acceleration and pk pk displacement level for the test Control This box displays the measured RMS...

Page 223: ... adjust or exchange the part under test without stopping the test Open Loop This button repeats the output signal continuously without control loop updates This allows you to maintain a constant output drive signal throughout the test Stop Code Info This box displays why the test shut down Click the Info button for more information on the current status of the test See Also Classical Shock Stop Co...

Page 224: ...the Run button and click the Yes button at the dialog box that asks if you want to continue or start from the beginning Run This button runs the test Click this button when you are ready to start your test This button will be gray when you are not running yellow when you are starting light blue if you are starting with a memorized drive and green when you are running Hold Timer When this button is...

Page 225: ... test schedule Total Time This box displays how much time has elapsed since the test started Current Time This box displays the current date and time Level This box displays the current level number and modifier value that the test is running Test Name This box displays the name of the test file that you are running Playback File This box displays the file that you are reading from in your test Pl...

Page 226: ...VibrationVIEW Help 213 1995 2005 Vibration Research Corporation All rights reserved See Also RecorderVIEW 309 ...

Page 227: ...Accelerometer Toolbars Part VI ...

Page 228: ...Field Data Replicator 6 2 System Check Channels System Check Accelerometers Toolbar This toolbar displays the acceleration velocity and displacement values for the active channels in your System Check test The channel label is highlighted RED if an accelerometer problem is detected See Also System Check Control Center 6 3 Sine Channels Sine Accelerometers Toolbar This toolbar displays the accelera...

Page 229: ...eter problem is detected See Also Random Control Center 6 5 Classical Shock Channels Classical Shock Accelerometers Toolbar This toolbar displays the measured peak acceleration levels for each of the input channels The channel label is highlighted RED if an accelerometer problem is detected See Also Classical Shock Control Center 6 6 Field Data Replicator Channels Field Data Replicator Acceleromet...

Page 230: ...VibrationVIEW Help 217 1995 2005 Vibration Research Corporation All rights reserved Field Data Replicator Control Center 211 ...

Page 231: ...Stop Codes Part VII ...

Page 232: ...es that Auto mode disabled itself because the output was increasing but there was no acceleration measured on the channel 1 input This is just a safety precaution to prevent the controller from increasing the output without limit when no accelerometer feedback is present Verify that There is an accelerometer connected to Channel n on the VibrationVIEW I O box The cable connections are all secure D...

Page 233: ...p option 7 2 5 Remote Stop Remote Stop System Check Stop Code This code indicates that the test was stopped using the Remote Start Stop option 7 2 6 Shorted Accelerometer Shorted Accelerometer System Check Stop Code This code indicates that an accelerometer connection is shorted Verify that The cable connections are all secure The input configuration is set up correctly If you are using external c...

Page 234: ...ove sum of the system masses If you get this error message either the parameters in the System Limits and or System Mass dialog boxes need to be adjusted to reflect the capabilities of your shaker or the current test requires a larger shaker than you are using 7 2 11 Desired Displacement is too high Desired Displacement is too high System Check Stop Code This code indicates that the displacement v...

Page 235: ...system This limit is defined in the System Limits dialog box If you get this error message either the velocity limit parameter in the System Limits dialog box needs to be adjusted to reflect the capabilities of your shaker or the current test requires a larger shaker than you are using 7 2 14 Emergency Stop Emergency Stop System Check Stop Code This code indicates that the emergency stop button wa...

Page 236: ...ed to reflect the capabilities of your shaker or the current test requires a shaker with a larger displacement range than you are using 7 2 19 Max Sine Velocity Max Sine Velocity System Check Stop Code This code indicates that the maximum velocity allowed for the system has been exceeded This limit is defined in the System Limits dialog box If you receive this error message either the velocity lim...

Page 237: ...ibrationVIEW I O unit comes loose The computer freezes The computer crashes 7 3 Sine Stop Codes 7 3 1 Changing Level Changing Level Sine Stop Code This code indicates that the test has finished one level and is starting another The test continues to run 7 3 2 End of Cycle Count Test End of Cycle Count Test Sine Stop Code This code indicates that the test was run for the scheduled number of sine wa...

Page 238: ...e Sine Control Center 7 3 8 Input channel N is clipping Input channel n is clipping Sine Stop Code This code indicates that the input signal to channel n is exceeding the allowable input voltage range of 10 volts and is being distorted by clipping To solve this problem use an accelerometer with a lower mV G sensitivity rating The maximum allowable acceleration readings for various accelerometer se...

Page 239: ...Accelerometer Open accel on channel n Sine Stop Code This code indicates that an accelerometer connection is open Verify that The cable connections are all secure The input configuration is set up correctly If you are using external conditioning turn off Accel Power Source in the Configuration Inputs dialog box 7 3 12 Paused Waiting for operator Waiting for operator Sine Stop Code This code indica...

Page 240: ...e Sine Big Display dialog box or by clicking the Hold Sweep button in the Sine Control Center 7 3 18 Running Test Running Sine Stop Code This code indicates that the test has completed the startup phase and is now running While the test is running the Level Time and Sweep counters shown in the Sine Control Center will count up down as appropriate for the current test The controller behavior during...

Page 241: ...ut The maximum allowed output voltage is defined by the smaller of the following values Max System Gain Desired Acceleration Max Output The Max System Gain parameter is also used to detect open accelerometer conditions If the measured acceleration level is less than Current Output Max System Gain the test will automatically be stopped with a Max Start System Gain stop code 7 3 22 Starting Schedule...

Page 242: ... resonance frequency If the problem is with the controller parameters see the section How to tune Sine controller parameters for information on how to improve the control 7 3 28 Channel N Plus Abort Channel n Plus Abort Sine Stop Code This code indicates that the measured acceleration has exceeded the plus abort lines set for channel n in the Sine Limits dialog box Typically this results from an a...

Page 243: ...hould not appear 7 3 32 Didn t Reach Demand Level Didn t Reach Demand Level Sine Stop Code This code indicates that the controller was either starting a test or switching test levels and failed to reach the demand level within 30 minutes The controller should even in the worst case be able to reach the demand level within one minute If you see this error it is likely that the controller parameters...

Page 244: ...xtremal limits as configured on the Extremal tab or can selected for comparison against the system limits using the System Limits Apply column on the Channels tab If a specific channel number is not given then this code indicates that the control acceleration value exceeded the maximum acceleration allowed for the system Note the acceleration limit for the system is a combination of the Force rati...

Page 245: ... If a specific channel number is not given then this code indicates that the overall control velocity value exceeded the maximum velocity allowed for the system The maximum velocity allowed for the system is defined in the System Limits dialog box 7 3 40 Max Start Drive Max Start Drive Sine Stop Code This code indicates that the maximum allowable voltage was reached when starting the test This err...

Page 246: ...ected it may be that the running Max System Gain limit for this test is too conservative This parameter is set in the Sine Limits dialog box Typically the maximum system gain allowed while the test is running should be about 125 to 150 of the maximum voltage acceleration ratio required over the entire frequency range of the test The Max System Gain limit is a safety limit used to prevent the outpu...

Page 247: ... to happen The VibrationVIEW I O unit is turned on after the program is started The Ethernet cable connecting the computer with the VibrationVIEW I O unit came loose The computer freezes The computer crashes 7 4 Random Stop Codes 7 4 1 Front Panel Start Front Panel Start Random Stop Code This code indicates that the test was started using the Start switch on the front panel of the VibrationVIEW I ...

Page 248: ...ng on batteries or UPS and the battery level is low The test is stopped in order to allow the computer to switch into suspend or hibernate mode before the batteries are completely exhausted 7 5 Shock Stop Codes 7 5 1 Changing Level Changing Level Shock Stop Code This code indicates that the test has finished one level and starting another The test continues to run 7 5 2 End of Test End of Test Sho...

Page 249: ...oading 7 5 7 Front Panel Start Front Panel Start Shock Stop Code This code indicates that the test was started using the Start switch on the front panel of the VibrationVIEW I O unit While this code is displayed the system is in the starting mode as described in the Starting Test stop code Once the desired level has been reached the test mode will change to Running Test 7 5 8 Record Exclusive Reco...

Page 250: ...onnected or your amplifier is not turned on You may need to adjust the starting Max System Gain parameter found in the Shock Parameters dialog box Note that it is typical for this message to be displayed when a test is started and then disappear after a few pulses The starting Max System Gain parameter will limit the rate at which the output increases The stop code box will be yellow while this li...

Page 251: ...ed on the graph The abort limits can be set in the Shock Limits dialog box 7 5 20 Daq Reset Daq Reset Shock Stop Code Daq Reset indicates a failure initializing the D A and A D converters in the 8500 I O box Under normal conditions this message should not appear The fault will automatically reset when you press the Run button If you get this error contact Vibration Research Corp at 616 669 3028 or...

Page 252: ...This code indicates that the Remote Start Stop and Remote Selection options are both enabled but the test number selected using the remote test selection input Discrete Inputs 4 5 6 7 does not have a valid test name configured for the current input settings Select the Configuration Remote Inputs menu command to verify that the test names configured there are valid See Also How to use remote inputs...

Page 253: ... e g 10 Volts for the Starting Max output parameter in the Test Edit Test Settings Limits dialog box 7 5 29 Max Shock Acceleration Max Shock Accleration Shock Stop Code This code indicates that the Maximum Shock Acceleration G peak for the test was reached This means that your test sent a shock acceleration to your shaker that it could not perform If you need to continue with this acceleration you...

Page 254: ...determined level and this level has been reached See Also How to use remote inputs to monitor your process 7 5 35 Run System Gain Limit Max Run System Gain Shock Stop Code This code indicates that the ratio between the output voltage and the measured acceleration exceeds the maximum value allowed while the test is running Perhaps the accelerometer is disconnected or your amplifier gain is turned d...

Page 255: ...t down condition Use the Field Data Replicator Schedule dialog box to change how long a test runs 7 6 4 Front Panel Start Front Panel Start Field Data Replicator Stop Code This code indicates that the test was started using the Start switch on the front panel of the VibrationVIEW I O box While this code is displayed the system is in the starting mode as described in the Starting Test stop code Onc...

Page 256: ...er or the Continue button in the Wait for operator dialog box The test will abort if the operator clicks either the Stop button in the Field Data Replicator Control Center or the Abort test button in the Wait for operator dialog box For more details on the test schedule refer to the Test Settings Schedule tab of the Field Data Replicator Test Settings dialog box 7 6 9 Remote Start Remote Start Fie...

Page 257: ... 6 15 Starting Test Starting Test Field Data Replicator Stop Code This code indicates that the test is currently in the startup mode where the output is slowly increased until the desired acceleration level is reached The controller behavior during the startup period is defined in the Field Data Replication Parameters dialog box 7 6 16 Starting Schedule Starting Scheduled Test Field Data Replicato...

Page 258: ...indicates a loss of closed loop control Check your accelerometer and drive cables to make sure all of the connections are secure 7 6 22 Computer Entering Suspend Mode Computer Entering Suspend Mode This code is given when VibrationVIEW is running a test the computer is running on batteries or UPS and the battery level is low The test is stopped in order to allow the computer to switch into suspend...

Page 259: ...um velocity allowed for the system See the section How to set the Shaker System Limits You may need to modify the parameters or get a bigger shaker 7 6 28 Invalid Remote Test Invalid Remote Test Field Data Replicator Stop Code This code indicates that the Remote Start Stop and Remote Selection options are both enabled but the test number selected using the remote test selection input Discrete Inpu...

Page 260: ...tio between the output voltage and the measured acceleration exceeds the maximum value allowed while starting the test Perhaps the accelerometer is disconnected or your amplifier is not turned on If necessary you may need to adjust the maximum system gain parameter found in the Field Data Replicator Limits dialog box 7 6 34 Max Run Voltage Max Run Voltage Field Data Replicator Stop Code This code ...

Page 261: ...ed See Also How to use remote inputs to monitor your process 7 6 40 Remote Monitor Low Remote Monitor Low Field Data Replicator Stop Code This code indicates that the rear inputs are configured to abort the test below a predetermined level and this level has been reached See Also How to use remote inputs to monitor your process 7 6 41 Test Parameters Changed Test Parameters Changed Field Data Repl...

Page 262: ...VibrationVIEW Help 249 1995 2005 Vibration Research Corporation All rights reserved The computer freezes The computer crashes ...

Page 263: ...Typical Views Part VIII ...

Page 264: ...bration Research Corporation All rights reserved 8 Typical Views 8 1 Overview Typical Views System Check Sine Random Classical Shock Field Data Replicator 8 2 System Check System Check CRT View 8 3 Sine Sine CRT View 251 251 252 253 254 ...

Page 265: ...Typical Views 252 1995 2005 Vibration Research Corporation All rights reserved 8 4 Random Random CRT View ...

Page 266: ...VibrationVIEW Help 253 1995 2005 Vibration Research Corporation All rights reserved 8 5 Classical Shock Classical Shock CRT View ...

Page 267: ...Typical Views 254 1995 2005 Vibration Research Corporation All rights reserved 8 6 Field Data Replicator Field Data Replicator CRT View ...

Page 268: ...VibrationVIEW Help 255 1995 2005 Vibration Research Corporation All rights reserved ...

Page 269: ...Dialog Boxes Part IX ...

Page 270: ...oxes Random dialog boxes Shock dialog boxes Field Data Replicator dialog boxes Edit Graph Elements dialog boxes Other dialog boxes 9 2 System Check Dialog Boxes 9 2 1 System Check Graph Settings System Check Graph Settings dialog box This dialog box is accessed by selecting the Graph Edit Graph Settings menu command or clicking the EditGraph toolbar button 270 117 ...

Page 271: ...omatically scale to match the magnitude of the inputs as they increase In the Graph Traces selection area you can define which traces you want to be displayed on your graphs You can create Black and White or Color graphs using the Style drop down list Insert Graph allows up to 4 graphs in a view The graphs will be vertically stacked and any graphs with matching horizontal axis will be linked for c...

Page 272: ...velocity etc vs frequency The second column selects plots of acceleration velocity etc vs time In the Axis Limits selection area you can define the minimum and maximum limits of the axes for the graphs You can also define the type of axis either logarithmic or linear In the Graph Traces selection area you can define which traces you want to be displayed on your graphs You can create Black and Whit...

Page 273: ...output This is useful for triggering stroboscopes at a frequency phase slightly shifted from the excitation frequency phase so that the stroboscope may be used to see device vibration in slow motion In Frequency mode shifts between 5 Hz and 5 Hz may be selected by dragging the slider or by typing a value in the offset box If a number is typed in the box you must click the Set button to activate th...

Page 274: ...e frequency value will put the controller in Hold mode at the frequency defined in this dialog box When the controller is stopped changing the frequency value will change the starting frequency for the sweep 9 3 4 Select Resonance Frequencies dialog box Select Resonance Frequencies dialog box This dialog box appears when running Sine test and the Resonance Table level is reached in the sine test s...

Page 275: ...new sequence Frequencies can be entered into the table manually or by using the mouse to select a frequency in the transmissibility graph To add or remove frequencies using the mouse move the cursor to the desired frequency in the graph hold down either the Shift or Ctrl key and click the left mouse button If you hold down the Shift key while clicking on the graph the exact frequency of the cursor...

Page 276: ...splay dialog box Sine Big Display dialog box Selecting View Sine Big Display menu command in Sine test mode displays this dialog box This display may be configured by right clicking on one of the eight parameter display areas and selecting the desired channel and parameter type from the drop down menu This dialog box also provides a feature for remote control using the mouse of the sweep direction...

Page 277: ...dom Graph Settings dialog box Random Graph Settings dialog box In Random test mode selecting Graph New Graph or Graph Edit Graph Settings menu command or clicking the EditGraph toolbar button displays this dialog box In the Graph Type selection area the first column selects plots of acceleration output drive etc vs frequency The second column selects plots of acceleration output drive etc vs time ...

Page 278: ...rsion 4 type Text at Bottom press the Insert Graph button to add another graph to the bottom then set the newly inserted graph type to Text Window Tip The Graph Legends fields can also include report parameter fields so you can include specific test values in these fields For example you can use the setting Started at PARAM StartTime to insert the time the test was started See Random report parame...

Page 279: ...w only active lines checkbox You can create Black and White or Color graphs using the Style drop down list Special graph type Text Window can be used to add additional space for text above or below the graphs To make a version 4 type Text at Bottom press the Insert Graph button to add another graph to the bottom then set the newly inserted graph type to Text Window Tip The Graph Legends fields can...

Page 280: ...licator Graph Settings dialog box In Field Data Replicator test mode selecting Graph New Graph Window New Window or Graph Edit Graph Settings menu command or clicking the Edit Graph toolbar button displays this dialog box In the Graph Type selection area you can define which type of graph you want to display In the Axis Limits selection area you can define the minimum and maximum limits of the axe...

Page 281: ...ted at PARAM StartTime to insert the time the test was started See Field Data Replicator report parameter names for a full list of parameter fields that can be used here 9 6 2 Field Data Replicator Graph Field Data Replicator Graph Use the Graph Edit Graph menu command to change the settings of this graph 9 6 3 Drive Check Dialog Box Drive Check dialog box This dialog box is automatically displaye...

Page 282: ... Data Replicator 9 6 5 Synthesize Sine Synthesize Size dialog box Selecting the File Edit Test Settings menu command or clicking the Settings button on the toolbar then clicking the Synthesize Sine Tones button on the Import tab while an FDR test is open accesses this dialog This utility allows you to create a field data replicator file based on superimposed sine tones Each 110 200 ...

Page 283: ...ns graph axis graph legends graph labels and any other items which are plotted In addition the right mouse button also will give a popup menu which allows the editing of these items In the white area of the graph the right mouse button performs both scaling and popup menu functions The popup menu will be displayed after the right mouse button has been held down for about 1 second The popup delay c...

Page 284: ... the view of the window Report parameters can be inserted into annotations using the format PARAM field System Check data values Sine data values Random data values Shock data values Field Data Replicator data values TEDS Data Values HTML form parameters can be inserted into annotations using the format FORM field See also How to use data entry forms 9 7 3 Edit Axis On a graph click the graph axis...

Page 285: ...g box allows either or both columns to be placed on the clipboard Clicking any number with the right mouse button will place the individual value on the clipboard The Columns can be dragged to Excel R or other windows application Place the mouse over the column header in this example Frequency Hz or Control G Hz and hold the left mouse button down while moving the mouse to the target application W...

Page 286: ... or annotations and chose modify to change the font and colors Font allows a selection from the list of windows fonts installed on the computer Font style allows Italic and Bold styles to be applied to the selected font Size allows the font size in point to be adjusted The Underline style can be applied with the underline checkbox 9 7 6 Edit Labels On a graph click the graph axis with the right mo...

Page 287: ...Dialog Boxes 274 1995 2005 Vibration Research Corporation All rights reserved 9 7 7 Edit Text On a graph click the Graph Legend with the right mouse button and select the Modify Graph Legend ...

Page 288: ...rationVIEW Help 275 1995 2005 Vibration Research Corporation All rights reserved 9 7 8 Edit Trace On a graph click the trace legend with the right mouse button and select the Modify Graph Trace trace name ...

Page 289: ...ted annually We provide this notice as a convenient reminder to you that your annual calibration is coming due See Also How to calibrate the system 9 8 2 Control Channel not on Primary Box Control channel not on primary box When using multi channel control at least one the four channels on the primary box must be selected as a Control Channel If you get this error message move one of your control ...

Page 290: ...g box This dialog box will display the values of the graph data at the current cursor position in the active graph The parameters displayed will be specific to the type of graph 9 8 4 Demo Registration dialog box Demo Registration dialog box Selecting Help Enter Registration Code menu command then clicking Request demo code pushbutton on Enter Registration dialog box displays this dialog box 119 1...

Page 291: ... and teaching tool To request demonstration mode fill in ALL the fields on this form and press the E Mail Request Form to send the form to Vibration Research You will receive registration e mail from Vibration Research Paste the received registration code into the Enter Registration Code dialog Box 9 8 5 Enter Registration Code dialog box Enter Registration Code dialog box Selecting Help Enter Reg...

Page 292: ...ls on configuring the software for file viewing functions without a VR8500 unit connect 9 8 6 I O Unit Initializing dialog box I O Unit Initializing dialog box This dialog box shows progress of the initialization process of the VibrationVIEW I O unit 9 8 7 Key Evaluation Mode expiration dialog box Free Evaluation Period Ends Soon dialog box A package has been enabled for evaluation and your evalua...

Page 293: ...when you run a test that requires a feature that is not installed For example you could get a Key not found notice when you run a Sine test if you have the Extremal mode enabled in the test but the Extremal option is not enabled in the key In this case edit the test and disable the Extremal mode See Also Help About menu command to see the list of installed packages 9 8 9 Memorized Drive dialog box...

Page 294: ...r simulator package 9 8 12 Motor Define Dialog Motor Define Motor Define dialog defines motor operation with the optional motor simulator package 9 8 13 Notice Message dialog box Notice Message dialog box This dialog box is used to provide a variety of notice messages The dialog box will stay open until the OK button is pressed but will not interrupt normal program operation 9 8 14 Password Entry ...

Page 295: ...ram 1 Run the Windows Registry Editor program From Windows click Start and then Run and then enter regedit in the run dialog and click OK 2 Find the section labeled HKEY_LOCAL_MACHINE Software Vibration Research Corporation VibrationVIEW 4 0 Password 3 This section should have two REG_SZ values Calibrate Program Double click on these values to change them If they are left blank then the password p...

Page 296: ...ic purposes It displays the input values for the 8 discrete inputs on the rear of the VR8500 unit The Aux Outputs can be cycled by pressing the output indicator pushbuttons 9 8 18 Recently run tests Recently Run Tests dialog box 9 8 19 Recent Stop Codes Recent Stop Codes dialog box Use this window to display and diagnose the most recently run tests Select one or more of the listed recent tests the...

Page 297: ...ation on the stop code for the listed test System Info Specifies information on your computer system and what programs are running on it Microsoft System Information MSInfo is a component of the Microsoft Operating System and also included with Microsoft Office This allows you to conveniently save a diagnostic file for Vibration Research support technicians Cancel Close this dialog See Also Help w...

Page 298: ...nges permanent To make these changes permanent you must be logged on to Windows as a Power User or Administrator or a user with access to the HKEY_LOCAL_MACHINE Software registry keys The changes will revert to previously set values when VibrationView is restarted 9 8 22 Run Name dialog box Enter Run Name dialog box Check the box labeled Prompt for Run Name when starting the test on the Data Stora...

Page 299: ...op level into the test schedule 9 8 24 TCP IP Server Failed to start TCP IP Server Failed to start One of the required network services built into the VibrationVIEW program failed to start This indicates that another program has the required network resources locked The error will prevent the IO unit from initializing It can usually be resolved by restarting Windows which will shutdown the offendi...

Page 300: ...the test you want the new test to follow and click the Add Test button You will be prompted for a test name When you click the Open button that test will be added to the schedule To remove programs from the test schedule select the test you want to remove and click the Remove Test button Click the Remove All button to clear all entries in the list To repeat a sequence of tests multiple times selec...

Page 301: ...f your hardware key does not have an option enabled you will still be able to switch to that mode define profiles and load and plot data sets but you will not be able to run the test Contact Vibration Research Corp for information on options that are not enabled 9 8 27 Wait for operator dialog box Waiting for operator dialog box A Wait for operator level in the test schedule tab pauses the test at...

Page 302: ...r Clicking either the Abort test button in this dialog box or the Stop button in the Control Center aborts the current test 9 8 28 Wait Message dialog box Wait message This dialog box indicates that a file transfer is in progress and provides feedback to the user as to how much remains before the transfer is complete Please wait until the transfer operation is complete and dialog box closes before...

Page 303: ...Windows Elements Part X ...

Page 304: ...nd on the document Control menu closes only one window at a time You can close all windows at once with the Close command on the File menu Shortcuts Keys CTRL F4 closes a document window ALT F4 closes the VibrationVIEW window or dialog box 10 1 2 Move command Move command Control menu Use this command to display a four headed arrow that allows you to move the active window or dialog box with the a...

Page 305: ...ts former size and position before you chose the Maximize or Minimize command 10 1 7 Size command Size command System menu Use this command to display a four headed arrow that allows you to resize the active window with the arrow keys After the pointer changes to the four headed arrow 1 Press one of the DIRECTION keys left right up or down arrow key to move the pointer to the border you want to mo...

Page 306: ... of the application and current document To move the window drag the title bar Note You can also move dialog boxes by dragging their title bars A title bar may contain the following elements Application Control menu Document Control menu Maximize button Minimize button Name of the application Name of the document Restore button 10 5 Toolbar Toolbar The toolbar is displayed across the top of the ap...

Page 307: ...s Open a stored data file File Open Data File Save the current data to a file File Save Data File Print the selected graph File Print Active Graph Create a report File Save As Report Document File Create a new graph Graph New Graph Autoscale the active graph Graph Full Autoscale Edit the active graph s settings Graph Edit Graph Settings Copy the active graph to the windows clipboard Graph Copy Gra...

Page 308: ... command The left area of the status bar describes actions of menu items as you use the arrow keys to navigate through menus This area also shows messages that describe the actions of toolbar buttons and the meaning of numbers as you move the mouse over the buttons and numbers respectively When the mouse is not over a toolbar or menu this area displays the current stop code The three other areas o...

Page 309: ...APPENDIX Part XI ...

Page 310: ...ge This is a common temperature range for many operating environments You must add additional temperature coefficient errors to the accuracy specification if you are operating the controller s outside a 23 C 5 C temperature Terminal Specifications Analog Input 1 2 3 and 4 Analog input 1 2 3 and 4 are general purpose analog inputs generally used to input mV accelerometers signals Both inputs are fu...

Page 311: ...APPENDIX 298 1995 2005 Vibration Research Corporation All rights reserved ...

Page 312: ...The VR8500 Drive output is paired with the VR8500 Aux output to produce the differential sinusoidal output The reference output is nominally 1 volt p p 0 707VRMS Each input can be verified both single ended and differentially The outputs and the inputs are verified simultaneously At frequencies below 5Hz the 34401A is used in 5 1 2 digit mode to acquire the reference at 300 Samples per Second usin...

Page 313: ...ation report If anything fails to meet the factory specification you will receive a warning message and the VR8500 must be recalibrated 17 If report indicates calibration is good the internal calibration timer can be reset Use menu Configuration Calibration to start a calibration Right click the next arrow to retrieve the existing calibration factors from the box Left click Next reset the internal...

Page 314: ...in table 8 2 2 Assign box to be calibrated to Channels 1 4 3 3 Calibrate the control box using the field procedure 4 4 Repeat steps 2 and 3 for each box 5 3 Restore existing control box assignments from table 8 Multiple VR8500 System Assign channels to Control Boxes s n Channels 1 4 Channels 5 8 Channels 9 12 Channels 13 16 Channels 17 20 Channels 21 24 Channels 25 28 Channels 29 32 table 8 11 2 A...

Page 315: ...tails 11 2 3 Tips and Tricks Sheet Miscellaneous Transducers can be named by going to the Configuration menu and selecting inputs Each channel can be given a specific name ex Ch1 could be Fixture and Ch2 could be Product This is useful for reporting as these names are carried throughout the graphs and other screen displays A quick method of getting to the Configuration table and properties for the...

Page 316: ...only the portion of the data that is controlled Edit Graph and select the box next to Show Only Active Lines When generating random profiles from recorded data the high Hz content that drops off and has no significant levels can be edited out by selecting the last significant Hz in the table and clicking Last Shock FDR When running tests close to the limits of the shaker set the Startup Rate and A...

Page 317: ...able 11 2 4 Earthquake Beat Test Earthquake Beat Test Q How do I run the earthquake beat test A To run a particular frequency 1 Create a new shock user defined pulse test 2 Select the desired waveletN txt file where N number of cycles 5 to 10 3 Set the sample frequency for import at 100 beat frequency for example for a 8 4Hz sine beat enter 840 for the sample frequency 4 Click the Import text file...

Page 318: ... controller but have U P S back up on my p c A You will see a test stop code message Lost Contact with IO box s n You can resume the test at this point assuming power is restored to the amplifier and controller Otherwise the data can be manually saved by clicking the Save Data button Or you can retrieve the data in the manner described above Also if you have data set to automatically save at the E...

Page 319: ... would like shown on your reports For details on these parameters please see your manual or in VibrationVIEW go to How to create custom reports There you will find a section for each mode of testing sine random etc The parameters found in the Help file can be copied and paste into your templates Also you can paste your company logo into this template Note Separate templates are used for each mode ...

Page 320: ...error signal is reduced by 70 over this time period so the smaller the value the quicker the control update Min response time sets the response time as the number of cycles of the vibration frequency Example If controlling at 1 Hz and the min response time is set to 10 cycles then the controller will remove 70 of the error signal in 10 seconds time In addition the slew rate puts a limit on the spe...

Page 321: ...ograms Accessories WordPad works well for creating editing report templates GRAPH SRS Demand Control Tol LogX LogY Damp5 GRAPH SRS Demand Control Tol LogX LogY Damp10 GRAPH SRS Demand Control Tol LogX LogY Damp15 GRAPH SRS Demand Control Tol LogX LogY Damp20 GRAPH SRS Demand Control Tol LogX LogY Damp25 11 2 9 Adobe Audition Manually link Adobe Audition to VibrationVIEW 1 Copy c program files Vibr...

Page 322: ... a cursor at a peak over a specific portion of the recording click and drag the desired area on the graph and follow the same steps as above 11 3 Appendix C RecorderVIEW Field Data Replicator File Format The VFW format is mat format from MatLab R The Data vector it is the realtime data as recorded with the VR8500 The sample frequency is specified in the scalar frequency Loading VibrationVIEW vfw f...

Page 323: ...ch integrates the acceleration waveform giving velocity and displacement with an optional high pass filter setting Output is in inches in sec and seconds This only integrates a single channel at a time disp vel time integrate_accel data 1 frequency hpf plot time disp TimeStamps Converting a timestamp to a date time in Excel R timestamp 86400 DATE 1970 1 1 To convert timestamp to a date time in Mat...

Page 324: ...big display 124 263 bitmap file 86 booting the box 279 browse 126 C cable 239 calibrate 20 106 calibrating 20 106 calibration 19 20 106 276 calibration required 276 cascade 125 change 234 241 248 change size 292 changed 234 241 248 changing 224 235 242 changing level 224 235 242 channel 117 channel 2 slip frequency 260 channel n minus abort 229 channel n plus abort 229 channels 117 124 140 160 180...

Page 325: ...demo 277 demo registration 277 demonstration mode 17 desired acceleration is too high 221 desired displacement is too high 221 desired velocity is too high 222 diagnostics 283 dialog box 130 149 171 189 259 260 261 263 264 265 267 268 269 276 277 278 279 280 281 283 285 286 287 288 289 dialog boxes 257 258 259 260 261 263 264 265 267 268 269 276 277 278 279 280 281 283 285 286 287 288 289 Field Da...

Page 326: ...cation filter 197 field data replication graph 267 268 field data replication graph settings 267 field data replication limits 195 field data replication parameters 193 field data replication schedule 191 field data replicator 24 27 74 81 109 189 211 251 254 Field Data Replicator Channels 216 field data replicator control center 211 field data replicator control prameters 37 field data replicator ...

Page 327: ...how to export data 30 how to import a waveform 38 how to import a waveform from a UFF file 38 how to import a waveform from an FDR file 38 how to import and export field data replicator waveforms 38 39 40 how to install hardware 9 16 how to install software 11 How to integrate VibrationVIEW into remote applications 40 47 50 54 how to read the front panel lights 18 how to record 38 how to record a ...

Page 328: ...act 222 231 239 246 low 119 M mass 95 MatLab 86 max 231 232 233 239 240 246 247 248 max acceleration 231 240 246 max displacement 231 240 max drive 226 232 max frequency 35 max g rms 247 max peak acceleration 246 max run drive 226 max run gain 233 247 max run system gain 233 247 max run voltage 240 247 max run volts 240 247 max shock acceleration 240 max shock displacement 240 max shock velocity 2...

Page 329: ...al cursor 120 next level 112 next window 292 no acceleration detected 219 221 non overlapped 125 normal 251 252 253 254 normal end 224 225 235 242 normal stop 224 225 235 242 notch 197 notch range 197 notice 281 notice message 281 notices 281 O offset 260 open 84 110 235 243 open accelerometer 220 226 235 243 open data 84 open recent test 84 open test 84 110 operation 19 operator 226 235 288 optio...

Page 330: ... 236 242 243 record active 226 236 243 record data 114 record data edit 115 record data pause 115 record data settings 115 record data stop 115 record exclusive 226 236 243 Record Settings 115 recorder buttons 124 recording 38 242 redraw 118 refresh 118 refresh graph 118 register 17 18 register hardware 128 registration 17 18 registry security error 285 relocate 291 remote 40 47 50 54 96 227 236 2...

Page 331: ...aker limits 20 shaker managing 95 shock 24 27 73 80 109 171 209 253 shock channels 216 shock control center 209 shock control channels 180 shock control parameters 35 shock crt view 253 shock data storage 182 shock define 171 shock dialog boxes 265 267 shock graph 265 267 shock graph settings 265 shock parameters 73 176 shock report graph types 80 shock report parameter names 73 shock schedule 173...

Page 332: ... 283 Field Data Replicator stop codes 242 243 244 245 246 247 248 shock stop codes 235 236 237 238 239 240 241 sine stop codes 224 225 226 227 228 229 230 231 232 233 234 system check stop codes 219 220 221 222 223 224 stop test 112 stopping 112 storage 142 161 182 199 store 29 store data 29 style 117 258 259 264 265 267 sweep 135 144 224 sweep rate 135 sweep speed 135 sweep tab 135 sweep type 135...

Page 333: ...bar 122 293 trace 117 258 259 264 265 267 traces 117 tracking filter 140 type 108 117 171 258 259 264 265 267 287 typical 251 252 253 254 typical screen 251 252 253 254 typical views 251 252 253 254 U UFF 38 units 93 update interval 193 user stop 224 227 229 234 236 238 243 244 245 V valley 119 velocity 232 240 verification 107 verify 19 version 128 VibrationVIEW test type 287 view menu 119 122 12...

Reviews: