Chapter 13, Configuring Xgig TraceView
Filter And Hide
276
Xgig Analyzer User’s Guide
The
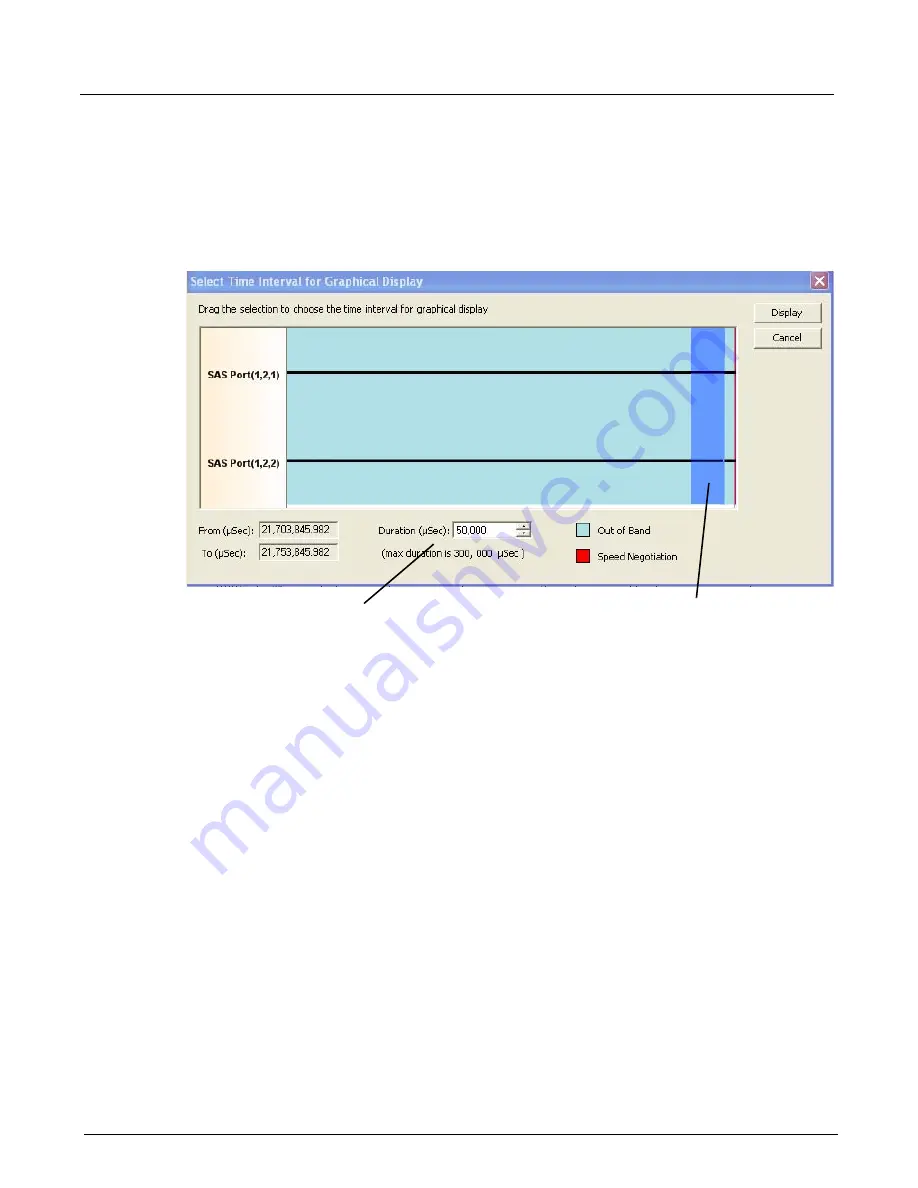
Select Time Interval for Graphical Display
dialog displays the time extents of the OOB
session. Duration for each of the ports in the port pair is shown as a horizontal line, and OOB and
SN periods within the time line are color-coded. Select the total time range to view in the
Duration
(uSec)
field (the maximum duration is 300 msec). Drag the selection area (lavender color) to
choose the time period for graphic display. Click the
Display
button to complete time interval
selection and view the OOB/SN graphical display.
Figure 119: Select Time Interval for Graphical Display
OOB/SN Graphical Display/Dialog Box
The OOB/SN graphical display and dialog box is shown in Figure 120. The OOB/SN graphical
display has two panes. The lower pane is the navigation pane and the upper pane is the events
pane. All the events in the OOB session (or events within the selected time range) are displayed in
the navigation window. A subset of OOB events are magnified and are shown in the events pane.
A toolbar and menu provide the controls to navigate, zoom, and print events.
Drag the Selection Area to
Sets the Width of the Selection Area (Duration)
Choose a Window of Time
Summary of Contents for Xgig
Page 1: ...Xgig Analyzer Version 7 3 User s Guide ...
Page 2: ......
Page 3: ...Viavi Solutions 1 844 GO VIAVI www viavisolutions com Xgig Analyzer Version 7 3 User s Guide ...
Page 6: ...Xgig Analyzer User s Guide Page iv Version 7 3 December 2015 ...
Page 7: ...v CONTENTS ...
Page 15: ...1 PART ONE Using Xgig Analyzer ...
Page 16: ...PART ONE Using Xgig Analyzer 2 Xgig Analyzer User s Guide ...
Page 27: ...13 PART TWO Using Xgig TraceControl ...
Page 28: ...PART TWO Using Xgig TraceControl 14 Xgig Analyzer User s Guide ...
Page 29: ...15 Chapter 2 About Xgig TraceControl In this chapter Introduction to TraceControl ...
Page 176: ...Chapter 6 Xgig TraceControl Hints and Tips Keyboard Shortcuts 162 Xgig Analyzer User s Guide ...
Page 177: ...163 PART THREE Using Xgig Performance Monitor ...
Page 178: ...PART THREE Using Xgig Performance Monitor 164 Xgig Analyzer User s Guide ...
Page 223: ...209 PART FOUR Using Xgig TraceView ...
Page 224: ...PART FOUR Using Xgig TraceView 210 Xgig Analyzer User s Guide ...
Page 225: ...211 Chapter 11 About Xgig TraceView In this chapter Introducing Xgig TraceView ...
Page 382: ...Chapter 15 Xgig TraceView Histograms Histogram Controls 368 Xgig Analyzer User s Guide ...
Page 383: ...369 Chapter 16 Xgig TraceView Template Editor In this chapter Using Template Editor ...
Page 437: ...423 PART FIVE Using Xgig Expert ...
Page 438: ...PART FIVE Using Xgig Expert 424 Xgig Analyzer User s Guide ...
Page 442: ...Chapter 21 Xgig Expert 428 Xgig Analyzer User s Guide Figure 194 Xgig Expert Graph View ...
Page 443: ...429 PART SIX Appendices ...
Page 444: ...PART SIX Appendices 430 Xgig Analyzer User s Guide ...
Page 454: ...Appendix C Protocol Display Color Coding 440 Xgig Analyzer User s Guide ...
Page 461: ...447 INDEX ...
Page 467: ......


