Chapter 10, Xgig Performance Monitor Configuration
Monitor Views
182
Xgig Analyzer User’s Guide
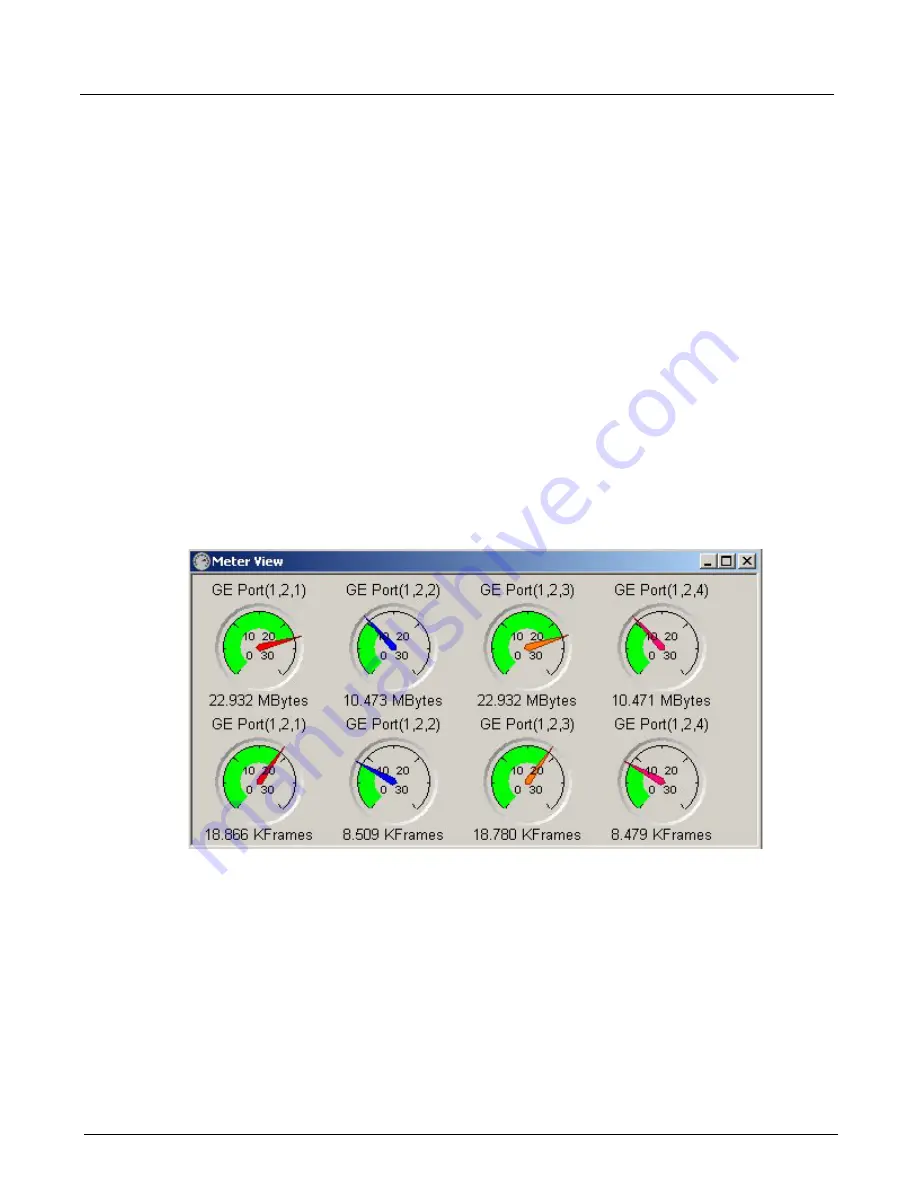
Meter View
Meter
View
displays the progression of data collection as an analog meter with a needle indicating
status. The
Meter View
presents the current transfer rate in Mbytes/sec and KFrames/sec for each
port.
Right-click
Meter View
to access the
Preferences
and
Metric Options
dialog boxes. All scaling
for the meters is done automatically and does not require configuration. All MByte meters will
have the same scale and all KFrame meters will have the same scale. However, the MByte and
KFrame meter scaling are independent of each other and solely based on the port that contains the
highest data rate in the configured domain.
MByte meters can be changed to display as a utilization percentage. Right-click the graph and
select the
Show Utilization
“Utilization Display Option” on page 205.
Snapshots of
all data over time can be logged in .csv files; see
“Statistics Logging Function” on page 207
.
When the Frame Type tab of the Preferences dialog is set to SCSI Frames, the Meter View will
display SCSI Megabytes per second and SCSI Kilo Commands per second. This option is
available for 1/2/4/8G Fibre Channel ports only.
An example of Meter View is shown in Figure 74.
Figure 74: Xgig Performance Monitor Meter View
List View
The
List View
presents vital statistics of each analyzer port or link such as utilization, data transfer
rate in KFrames/sec, data transfer rate in MBytes/sec, frame errors, SAS/SATA error counters,
PCIe errors, and phy errors. A
Total
row is also displayed depending on the selection from the
Resource Browser. The statistical information is presented on several tabs within the view, so you
can easily access the columns of information you want to view. The number of statistical tabs
available is dependent on the types of analyzer ports configured in the domain.
Summary of Contents for Xgig
Page 1: ...Xgig Analyzer Version 7 3 User s Guide ...
Page 2: ......
Page 3: ...Viavi Solutions 1 844 GO VIAVI www viavisolutions com Xgig Analyzer Version 7 3 User s Guide ...
Page 6: ...Xgig Analyzer User s Guide Page iv Version 7 3 December 2015 ...
Page 7: ...v CONTENTS ...
Page 15: ...1 PART ONE Using Xgig Analyzer ...
Page 16: ...PART ONE Using Xgig Analyzer 2 Xgig Analyzer User s Guide ...
Page 27: ...13 PART TWO Using Xgig TraceControl ...
Page 28: ...PART TWO Using Xgig TraceControl 14 Xgig Analyzer User s Guide ...
Page 29: ...15 Chapter 2 About Xgig TraceControl In this chapter Introduction to TraceControl ...
Page 176: ...Chapter 6 Xgig TraceControl Hints and Tips Keyboard Shortcuts 162 Xgig Analyzer User s Guide ...
Page 177: ...163 PART THREE Using Xgig Performance Monitor ...
Page 178: ...PART THREE Using Xgig Performance Monitor 164 Xgig Analyzer User s Guide ...
Page 223: ...209 PART FOUR Using Xgig TraceView ...
Page 224: ...PART FOUR Using Xgig TraceView 210 Xgig Analyzer User s Guide ...
Page 225: ...211 Chapter 11 About Xgig TraceView In this chapter Introducing Xgig TraceView ...
Page 382: ...Chapter 15 Xgig TraceView Histograms Histogram Controls 368 Xgig Analyzer User s Guide ...
Page 383: ...369 Chapter 16 Xgig TraceView Template Editor In this chapter Using Template Editor ...
Page 437: ...423 PART FIVE Using Xgig Expert ...
Page 438: ...PART FIVE Using Xgig Expert 424 Xgig Analyzer User s Guide ...
Page 442: ...Chapter 21 Xgig Expert 428 Xgig Analyzer User s Guide Figure 194 Xgig Expert Graph View ...
Page 443: ...429 PART SIX Appendices ...
Page 444: ...PART SIX Appendices 430 Xgig Analyzer User s Guide ...
Page 454: ...Appendix C Protocol Display Color Coding 440 Xgig Analyzer User s Guide ...
Page 461: ...447 INDEX ...
Page 467: ......


