Chapter 9, Xgig Performance Monitor Port Configuration
Select Ports to Monitor Dialog Box
174
Xgig Analyzer User’s Guide
The dialog box displays an icon for each port, arranged as they physically exist within the analyzer
hardware device(s). To select a port, click the port. Ports are always selected in pairs, so the port
and remaining port of the port-pair are selected. Click ports again to remove them from the
selections. Selected ports have a blue background; unselected ports have a white background.
The icons change as the selection, availability, and type of each port changes. See Selecting
Chassis, Blades, and Ports for information on the display of port icons. See
for information on how to change the function of ports.
When selecting ports to monitor in Performance Monitor, you cannot explicitly create links. You
can select either ports or a domain to monitor.
When Performance Monitor is launched from TraceControl, any defined links in TraceControl’s
domain will be shown. Ports viewed in Performance Monitor that are chosen by selecting a
domain from the domains tree will be shown with any defined links.
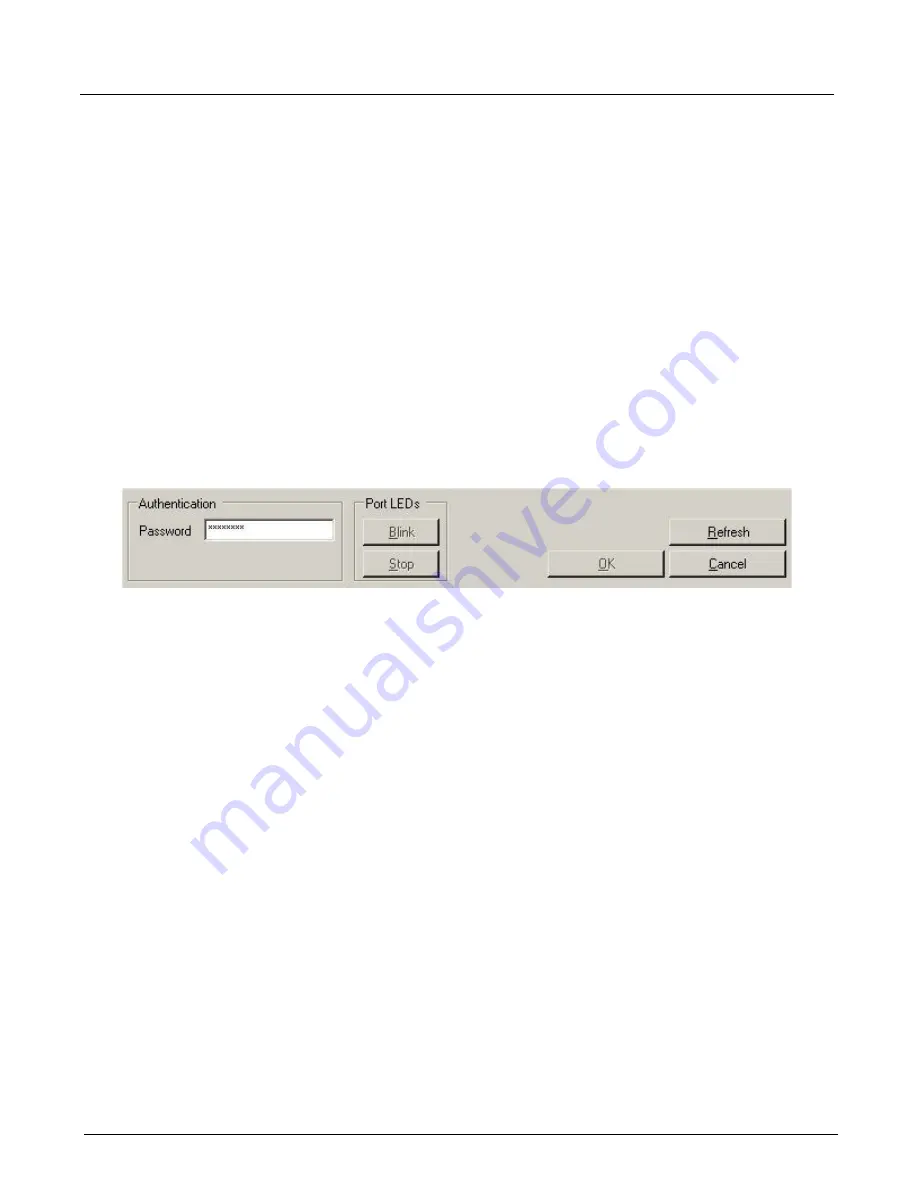
Dialog Buttons
If you are not logged into the Sync Group that contains the resources in the domain, use the
Password
field to login. Login is only required if the Sync Group is password protected.
The following buttons are available:
•
Blink
Causes the LEDs for the selected ports to blink. LEDs will blink for 40 seconds.
•
Stop
Causes the LEDs to stop blinking.
•
OK
Exit and use the selected ports for monitoring.
•
Refresh
Updates the status of blades and ports in the right panel and available hosts in the left panel.
•
Cancel
Exit without changes.
Summary of Contents for Xgig
Page 1: ...Xgig Analyzer Version 7 3 User s Guide ...
Page 2: ......
Page 3: ...Viavi Solutions 1 844 GO VIAVI www viavisolutions com Xgig Analyzer Version 7 3 User s Guide ...
Page 6: ...Xgig Analyzer User s Guide Page iv Version 7 3 December 2015 ...
Page 7: ...v CONTENTS ...
Page 15: ...1 PART ONE Using Xgig Analyzer ...
Page 16: ...PART ONE Using Xgig Analyzer 2 Xgig Analyzer User s Guide ...
Page 27: ...13 PART TWO Using Xgig TraceControl ...
Page 28: ...PART TWO Using Xgig TraceControl 14 Xgig Analyzer User s Guide ...
Page 29: ...15 Chapter 2 About Xgig TraceControl In this chapter Introduction to TraceControl ...
Page 176: ...Chapter 6 Xgig TraceControl Hints and Tips Keyboard Shortcuts 162 Xgig Analyzer User s Guide ...
Page 177: ...163 PART THREE Using Xgig Performance Monitor ...
Page 178: ...PART THREE Using Xgig Performance Monitor 164 Xgig Analyzer User s Guide ...
Page 223: ...209 PART FOUR Using Xgig TraceView ...
Page 224: ...PART FOUR Using Xgig TraceView 210 Xgig Analyzer User s Guide ...
Page 225: ...211 Chapter 11 About Xgig TraceView In this chapter Introducing Xgig TraceView ...
Page 382: ...Chapter 15 Xgig TraceView Histograms Histogram Controls 368 Xgig Analyzer User s Guide ...
Page 383: ...369 Chapter 16 Xgig TraceView Template Editor In this chapter Using Template Editor ...
Page 437: ...423 PART FIVE Using Xgig Expert ...
Page 438: ...PART FIVE Using Xgig Expert 424 Xgig Analyzer User s Guide ...
Page 442: ...Chapter 21 Xgig Expert 428 Xgig Analyzer User s Guide Figure 194 Xgig Expert Graph View ...
Page 443: ...429 PART SIX Appendices ...
Page 444: ...PART SIX Appendices 430 Xgig Analyzer User s Guide ...
Page 454: ...Appendix C Protocol Display Color Coding 440 Xgig Analyzer User s Guide ...
Page 461: ...447 INDEX ...
Page 467: ......


