VTBAL14
27.07.2010
©Velleman nv
5
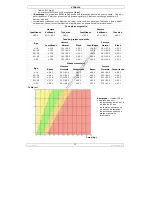
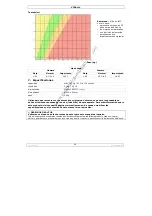
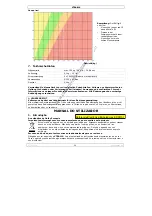
*Note:
the health indication bar
[c]
gives a general indication of your overall health: 1 bar =
underfat, 3 bars = healthy, 6 bars = overfat, 9 bars = obese
o
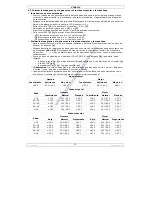
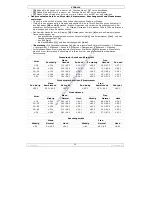
See below for some charts to help you evaluate your physical condition. These figures are for
information only. You should always consult your physician for a professional medical evaluation.
Body Fat Percentage
Age
Male
Female
Underfat Healthy Overfat
Underfat
Healthy
Overfat
≤
19
≤
11.0 11.1~22.0
≥
22.1
≤
16.0 16.1~27.0
≥
27.1
20~29
≤
12.0 12.1~23.0
≥
23.1
≤
17.0 17.1~28.0
≥
28.1
30~39
≤
13.0 13.1~24.0
≥
24.1
≤
18.0 18.1~29.0
≥
29.1
40~49
≤
14.0 14.1~25.0
≥
25.1
≤
19.0 19.1~30.0
≥
30.1
≥
50
≤
15.0 15.1~26.0
≥
26.1
≤
20.0 20.1~31.0
≥
31.1
Water percentage
Male
Female
Low
Good Very
good
Low
Good Very
good
≤
50.0 50.1~65.0
≥
65.1
≤
45.0 45.1~60.0
≥
60.1
Muscle Percentage
Age
Male
Female
Low Normal
High
Low
Normal
High
≤
19
≤
36.0 36.1~41.0
≥
41.1
≤
44.0 44.1~56.0
≥
56.1
20~29
≤
34.0 34.1~39.0
≥
39.1
≤
42.0 42.1~54.0
≥
54.1
30~39
≤
33.0 33.1~38.0
≥
38.1
≤
41.0 41.1~52.0
≥
52.1
40~49
≤
31.0 31.1~36.0
≥
36.1
≤
40.0 40.1~50.0
≥
50.1
≥
50
≤
28.0 28.1~34.0
≥
34.1
≤
37.0 37.1~47.0
≥
47.1
Bone percentage
Male
Female
Low normal High
Low Normal High
≤
5.0 5.1~10.0
≥
10.1
≤
4.5 4.51~9.5
≥
9.51
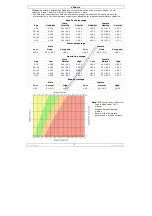
Note:
BMI figures do not apply for:
o
People aged under 18 or
elderly
o
Pregnant/breast feeding
women
o
People with high muscle
percentage e.g. body builders


