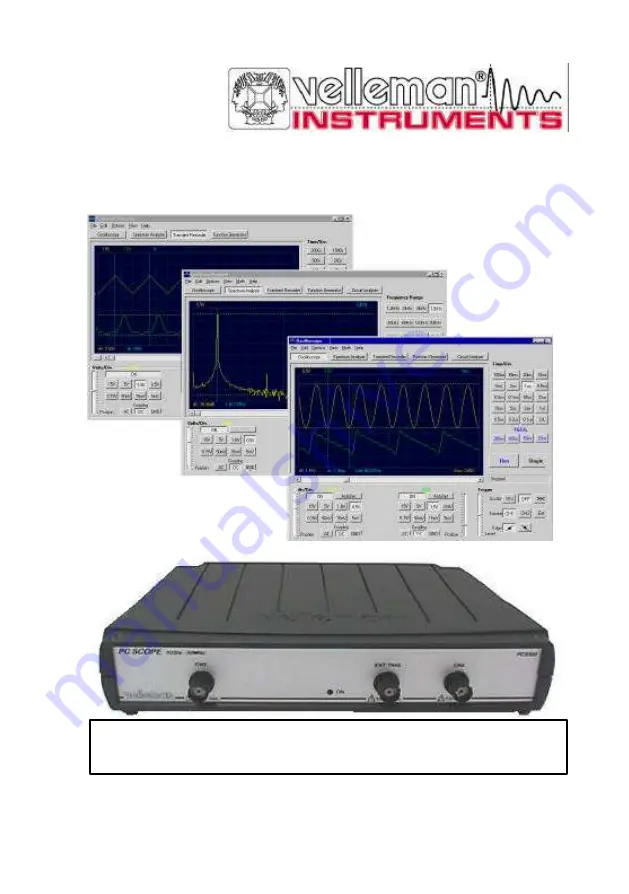
PC Scopes
CHECK THE
Pc- Lab2000
TM
GETTING STARTED GUIDE
FOR SOFTWARE INSTALLATION
R
e
f
r
n
c
M
a
u
l
PCS500 PCS100 / K8031
Page 1: ...PC Scopes CHECK THE Pc Lab2000TM GETTING STARTED GUIDE FOR SOFTWARE INSTALLATION R Re ef fe er re en nc ce e M Ma an nu ua al l PCS500 PCS100 K8031...
Page 2: ...PCS500 PCS100 K8031 2 VELLEMAN Instruments is a division of VELLEMAN Components NV Legen Heirweg 33 9890 Gavere Belgium Support updates http www Velleman be Velleman Instruments HPCS500_UK 2001 1...
Page 3: ...enna Increase the separation between the equipment and receiver Connect the equipment into an outlet on a circuit different from that to which the receiver is connected Consult the dealer or an experi...
Page 4: ...ed from the computer port Any waveform displayed on the screen can be stored for later use in documents or for comparison of waveforms Together with the PCG10 function generator a powerful Bode plotte...
Page 5: ...Repetitive 1 GHz Equivalent Sampling Rate PCS100 K8031 Oscilloscopes Time base 0 1us to 100ms per division Trigger source CH1 or free run Trigger level adjustable per division Input sensitivity 10mV t...
Page 6: ...es 1 sample 20s Markers for time and amplitude Zoom function Record and display of screens Data format ASCII Spectrum analyser Frequency range PCS500 0 1 2kHz to 25MHz Frequency range PCS100 K8031 0 4...
Page 7: ...ve all test leads before opening the enclosure in order to avoid electrical shock Use a measuring probe with an insulated connector e g type PROBE60S when measuring voltages exceeding 30V Before makin...
Page 8: ...l trigger input max input 100Vp AC DC only PCS500 3 Power indication LED software driven 4 Adapter connection observe the polarity 5 Parallel port connector 6 X10 probe testing signal at front panel f...
Page 9: ...perienced service center to replace the fuse The best way is to cut the leads of the fuse and to solder a new 2A PICO 1A for PCS100 K8031 fuse onto the old leads After starting the software see also g...
Page 10: ...ifically analyzed Thus the calculation of RMS values is no problem although remember that the displayed RMS value is only for the AC component of the measured signal By using the markers the signal fr...
Page 11: ...e solution to this problem Because the incoming signal is digitized it is possible for the signal to be scientifically converted into its frequency spectrum using FFT Fast Fourier Transforms With the...
Page 12: ...ve the same color as the vertical time frequency markers Oscilloscope mode DSO VOLTS DIV Selected value indicates the peak to peak voltage required to produce a peak to peak deflection of one major di...
Page 13: ...erence point Triggering reference mark is displayed with the vertical line on the bottom of the screen PCS100 K8031 Resets the trace starting from the triggering point RUN Selects recurrent display up...
Page 14: ...ing occurrences to gather the data to construct a picture of a repetitive signal Hint for 1GS s sampling A repetitive pulse sequence CH2 can be displayed if a repetitive triggering signal CH1 is avail...
Page 15: ...ANGE Sets the frequency range of the display It is necessary to slide the screen using X POSITION in order to see the full range LOG LIN To display the frequency on a linear or logarithmic scale ZOOM...
Page 16: ...lt subdirectory folder DATA for image and data files is created when the program is run the first time Print Prints the image in gray scale Printer must be connected to other LPT port than the oscillo...
Page 17: ...ow function used to taper the original signal before calculating the FFT FFT Options Maximum Maximum value of each frequency is displayed in Run mode This option can be used for recording signal level...
Page 18: ...lue of the signal If CH1 is on the dBm value of CH1 is shown If CH1 is off the dBm value of CH2 is shown 0 dBm 1 milliwatt at 600 ohms 0 775 Vrms Markers in oscilloscope mode Two horizontal markers fo...
Page 19: ...ed Ch1 Ch2 Ch1 Ch2 XY Plot Invert Ch2 XY Plot Ch1 data is displayed on Y axis Ch2 data is displayed on X axis A button is provided to toggle between Math mode and Normal mode Help Menu Contents Displa...
Page 20: ...s The signal recorder is nothing other than an oscilloscope with a very slow time base The advantage of a digital recorder is that the signals can be stored on disk so that they can be used for analys...
Page 21: ...input amplifier attenuator Only the AC components are measured GND not for K8031 the input signal is broken and the input amplifier attenuator is connected to earth Use this position for selecting a...
Page 22: ...a in text format to a file AutoSave Data Saves all next screens of data in text format to a file The AutoSave function will be activated after the Run button is pressed The AutoSave function will be f...
Page 23: ...markers are selected the absolute time of the marker position is displayed If V dt markers are selected the time difference between the markers is displayed Moving the markers Place the mouse pointer...
Page 24: ...rinter port card The voltage readout does not correspond to the actual value The probe is in the X10 position Note the RMS readout measures only the AC voltage The oscilloscope must be calibrated Erro...
Page 25: ...chase invoice VELLEMAN Components limits its responsibility to the reparation of defects or as VELLEMAN Components deems necessary to the replacement or reparation of defective components Costs and ri...