


Analytical Functions
6-15
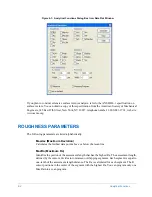
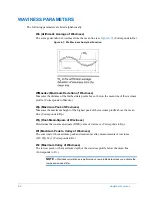
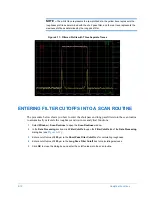
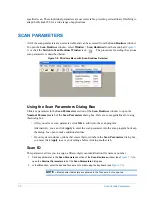
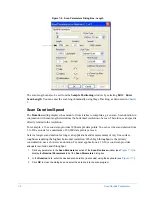
NOTE –
When you use the default scan routine, the raw profile data is entered as the
Display Data Type
parameter. In this exercise, all three data types are selected.
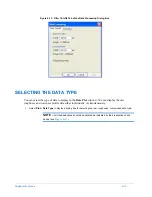
2
Select the
Waviness
and
Roughness
check boxes to enter all three data types into the scan routine.
NOTE –
You cannot select the roughness data type unless you first activate the short pass
filter. Likewise, you cannot select the waviness data type unless you first activate the long
pass filter.
3
Click
OK
.
After you enter the analytical functions, cutoff filters, and display data types into the current scan
routine, they automatically execute whenever the current scan routine runs.
MEASURING AND ENTERING ANALYTICAL FUNCTIONS
After you activate the short pass roughness filter, perform the average roughness analytical function a
second time. You can enter one or more analytical functions into the current scan routine from the
Data Plot
window to be automatically calculated whenever the current scan routine runs. In the
exercise that follows, you will learn the procedure for measuring the Ra function and entering it into
the scan routine.
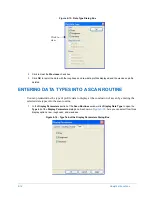
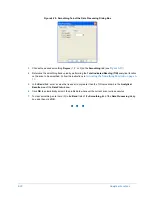
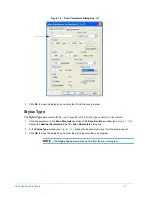
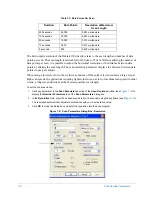
1
Select
Analysis
>
Analytical Functions
from the
Data Plot
window to open the
Analytical Functions
dialog box (see
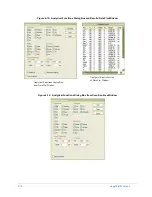
NOTE –
You can also open the
Analytical Functions
dialog box from the
Scan Routines
window. When you do this, the dialog box appears as shown in
.
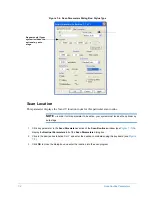
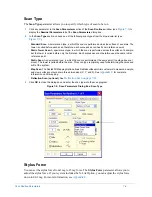
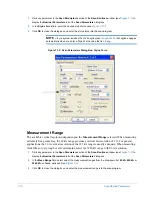
2
Under
Roughness
in the
Analytical Functions
dialog box, click
Ra
.
3
Select
Measure and Program
in the
Analytical Functions
dialog box.
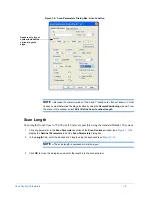
4
Click
Compute
to close the
Analytical Functions
dialog box, perform the measurement, and enter the
average roughness into the current scan routine.
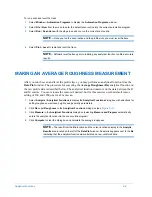
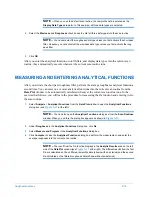
NOTE –
The result from the Ra function displays in the
Analytic Results
area on the left
side of the
Data Plot
window
at the right). The different results from the first
Ra are calculated on the unfiltered raw profile data (shown with an asterisk) and the second
Ra calculated on the filtered roughness data (shown without an asterisk).
Summary of Contents for Dektak 150
Page 1: ......
Page 7: ......
Page 17: ......
Page 81: ......
Page 105: ......
Page 149: ......
Page 191: ......
Page 251: ......
Page 257: ...A 6 Facilities Specifications Figure A 6 Dektak 150 without Enclosure Side View ...
Page 258: ...Facilities Specifications A 7 Figure A 7 Dektak 150 Dimensions without Enclosure Top View ...
Page 259: ...A 8 Facilities Specifications Figure A 8 Dektak 150 without Enclosure Center of Mass ...
Page 273: ......
Page 283: ......
Page 321: ......
Page 331: ......
Page 333: ......
Page 336: ......
Page 337: ......
Page 349: ......