28
Programming with TIDE
©2000-2008 Tibbo Technology Inc.
Release Mode
Release mode means business. This is the mode in which you compile the final
files, deployed in the field. Under this mode, the working assumption is that you,
or anybody else, isn't there. Your box is just supposed to run and run, despite any
and all problems and errors.
This means that a release version does not respond to any debug commands. You
cannot stop it. It does not stop even when critical errors occur. It also means that
when you upload a release version to your target, it starts running immediately.
Even if you reboot your device, when it has a Release Mode binary in memory, it
will start running.
Debugging Your Project
One of the most common operations you will perform during your development
process is debugging. In essence, this involves controlled execution of your
project. While debugging you can step through your program, set breakpoints,
watch and change the state of various variables, see how control and decisions
statements are executed, etc.
One of the aspects of TIDE is that it employs a technique called cross-debugging.
Simply put, this means your code runs on a different machine than the one on
which you wrote it, and you can debug it from the computer on which you wrote
the program.
Thus, code is not debugged using some PC emulator or anything of this sort. It is
truly uploaded and run on your target -- just like it would run in real life.
As covered
, the first thing you would have to do to begin debugging a
debug binary would be to run it, using F5. Once you press F5 (or Debug > Run),
your project will be built (if necessary), uploaded (if necessary) and started.
Once execution has started, there are several ways in which you may control and
inspect it. These are listed below.
4.1.8.1
Target States
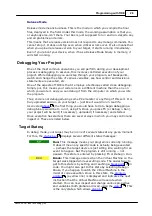
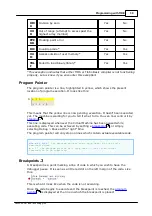
In debug mode, your target may be in one of several states at any given moment.
For this, the
displays several different status messages:
Run: This message means your program is currently running.
It doesn't mean any specific code is actually being executed
-- perhaps the target device is just sitting idle, waiting for an
event to happen. But the program is still running -- not
paused. This state is entered by pressing F5 or Debug > Run.
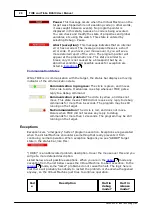
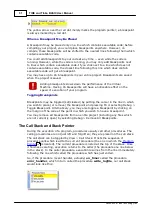
Break: This message occurs when the Virtual Machine on the
target was stopped while executing code. The easiest way to
get to this state is by setting and reaching a
in
code. You might also get to this state by selecting Debug >
Pause, if you happen to catch the Virtual Machine in the
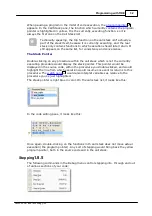
midst of code execution. Once in this state, the
(a yellow line) is displayed and indicates the next
instruction that the Virtual Machine will execute when
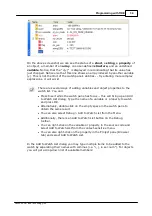
started. You can now inspect and change various properties
and variables (both global and local) using the
. This
is the only state which allows
.
26
126
30
30
33
32

