


BC207 Series
Chapter 5: The Graphics User Interface (GUI)
Page 51
MTN026962-D02
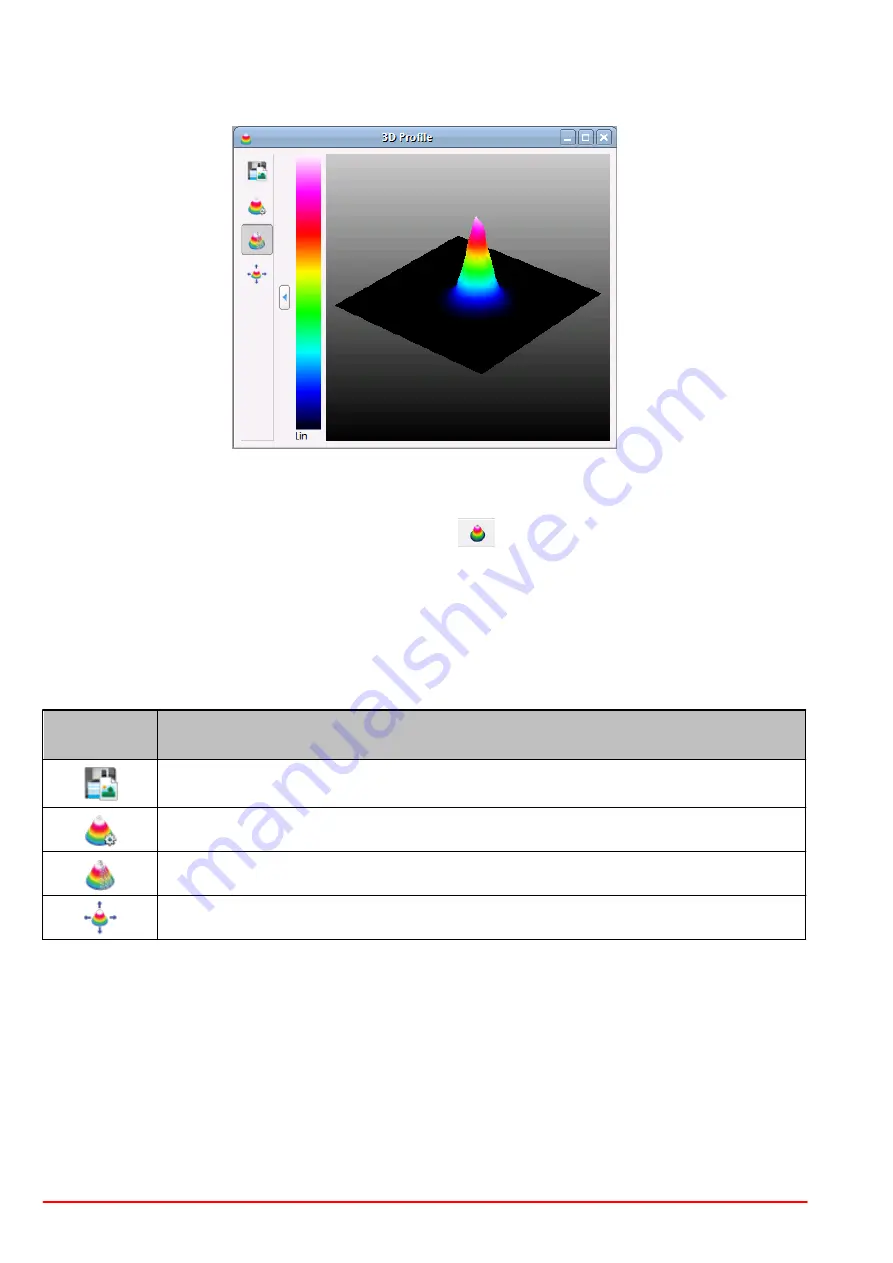
5.6.2 3D Profile
The 3D Profile illustrates the power density distribution of the measured optical beam. Whereas
the beam's cross-section is parallel with the X-Y-plane, the relative power intensity is shown in
the Z direction (Pseudo 3D). This window can be opened and closed via the menu item "3D
Profile" in the window menu or via the toggle button
in the toolbar.
The 3D profile can be moved, rotated and zoomed with the mouse:
Rotate
:
Press right mouse button and move mouse
Move:
Press left mouse button and move mouse
Zoom:
Scroll mouse wheel
The following table summarizes the toolbar symbols available within the 3D Profile window and
its appropriate action.
Toolbar
Icon
Associated Action
Opens a dialog box to specify the properties of the saved screenshots / dia-
grams.
Opens the 3D Profile Settings dialog box.
Toggles the appearance of the profile between solid to wired (default).
Resets the manipulations of translation, rotation and zoom to the default view.
Position, size and rotation angle are also displayed within the 3D Profile Settings dialog box.
Numerical values can be set to define the 3D Profile appearance:
Summary of Contents for BC207UV
Page 2: ...Copyright 2022 Thorlabs Version Date 8 1 10 Jan 2022 ...
Page 103: ...BC207 Series Chapter 6 Operation Instructions Rev 8 1 10 Jan 2022 Page 96 2022 Thorlabs ...
Page 133: ...BC207 Series Chapter 6 Operation Instructions Rev 8 1 10 Jan 2022 Page 126 2022 Thorlabs ...
Page 181: ...www thorlabs com ...