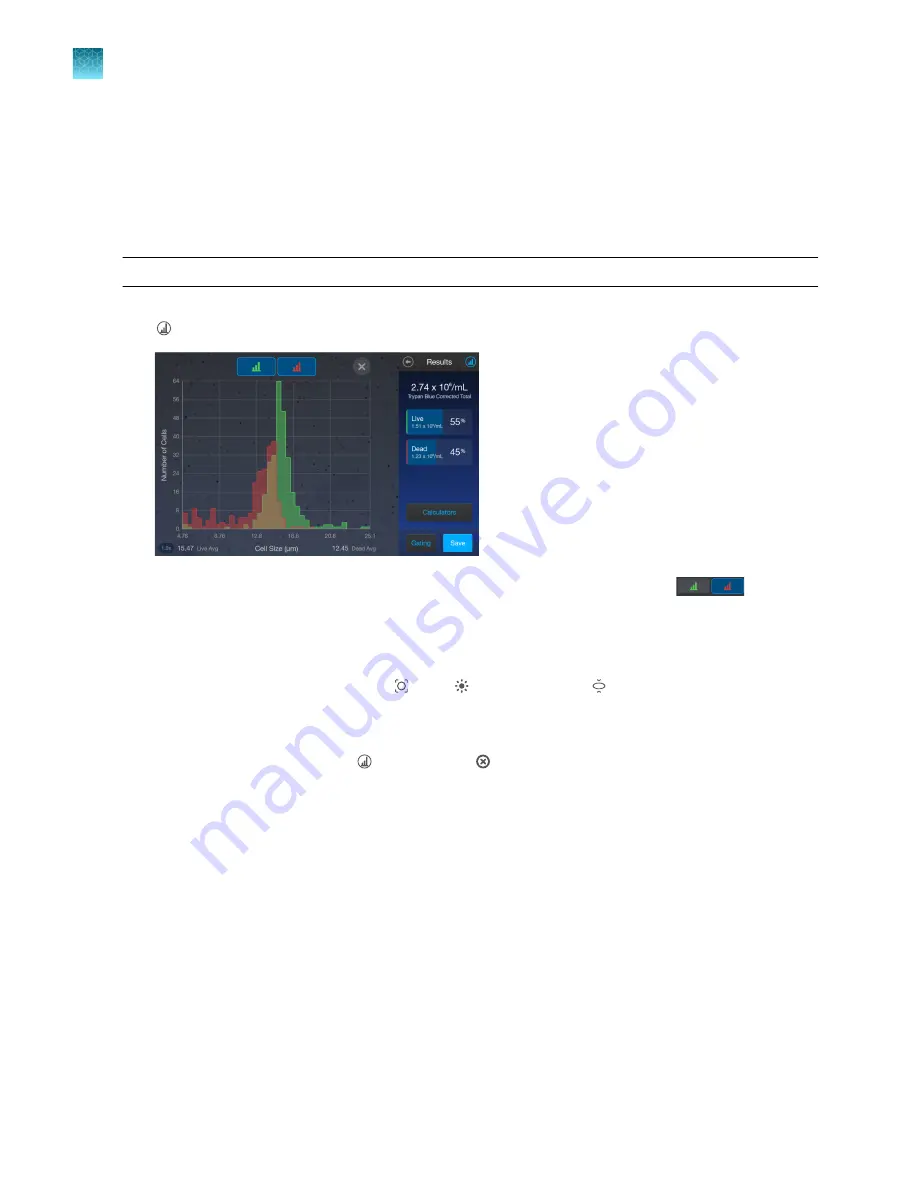
Histogram count results
View histogram
For cell count and cell viability assays performed in the brightfield channel, you can view the distribution
of cells (live and/or dead) based on size in a graphical format.
Note:
You can view the histogram on the
Results
and
Gating
screens.
1.
To view the histogram showing the distribution of live and/or dead cells based on cell size, press
Histogram
.
2.
To view the distribution of only the live or dead cells, press the corresponding
Live
(green) or
Dead
(red) button.
The graph will automatically update and display the distribution of cells based on size only in the
selected population.
3.
(Optional)
: Press
Gating
. Using the
Size
,
Brightness
, and
Circularity
sliders, adjust the
count parameters. As you adjust the count parameters, the count results and the graph will be
automatically updated.
4.
To close the histogram, press
Histogram
or .
Gate count results
Gating screen
The
Gating
screen for cell count and cell viability assays in the brightfield channel contains the controls
for gating results based on size, brightness, and circularity. You can adjust the count parameters before
or after performing a count, and save these changes to the current profile or as a separate profile (“Save
as new template”
Chapter 5
Cell count and cell viability assays
Histogram count results
5
26
Countess
™
3 Automated Cell Counter User Guide
Summary of Contents for Invitrogen AMQAX2000
Page 55: ......


