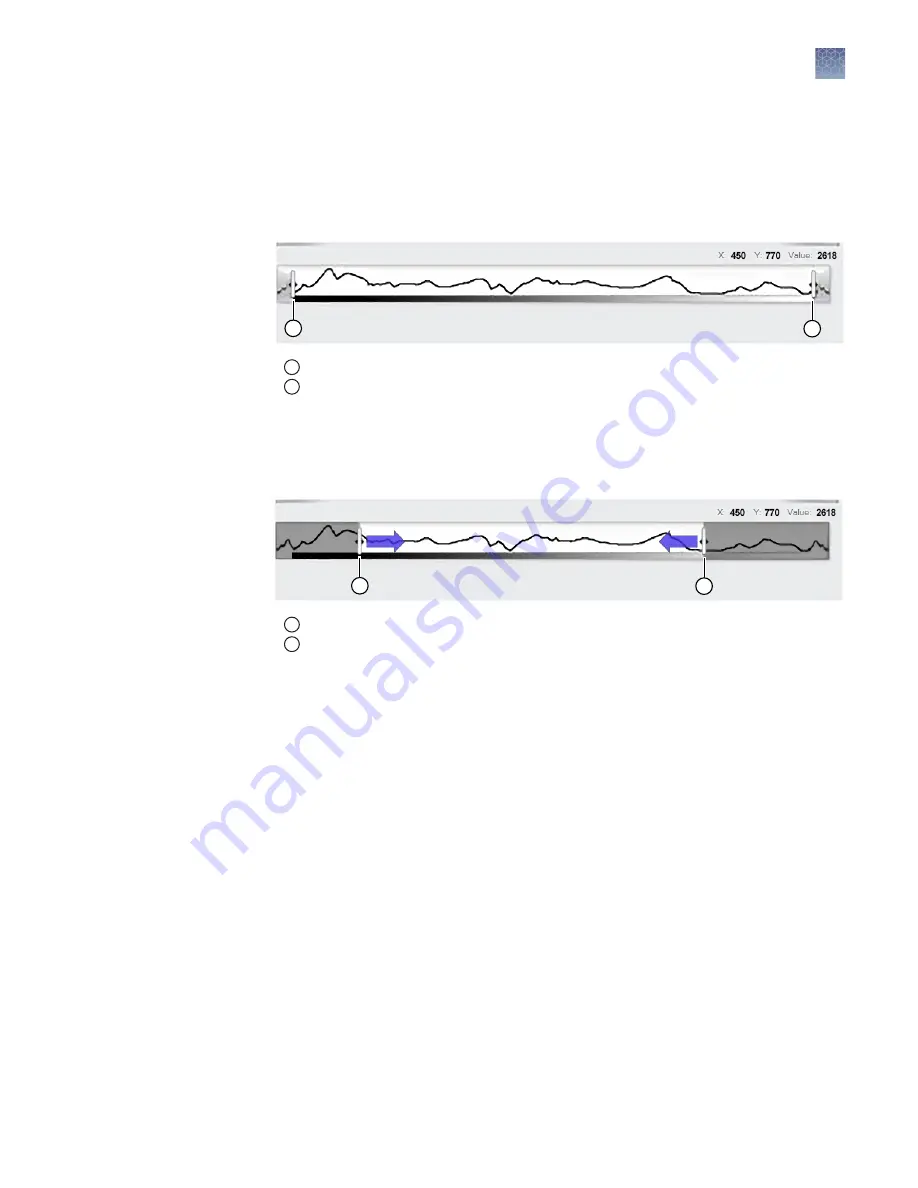
About the histogram
The histogram provides the user with a graphical version of the image data to help
determine the optimal image capture conditions. When an image is detected, the
histogram is displayed at the bottom of the screen.
1
2
1
Left cursor
2
Right cursor
The y-axis of the histogram displays the number of pixels at a given gray level. The
x
‑
axis displays the type of the gray levels. You can reduce the time that is taken to
view the band by stretching the signal. This can be achieved by dragging the cursor
at the left and right margins of the histogram, and moving them towards the center.
1
2
1
Left cursor
2
Right cursor
Perform extended detection
This tool is used to increase dynamic range for optimal capture of images in gels that
contain bands of both high and low intensity.
1.
View the gel in the
Live mode
screen.
2.
Click the
Extended detection
tab.
3.
Adjust sensitivity using the
+
/
–
slide gauge to optimize the image.
4.
Adjust brightness using the
+
/
–
slide gauge to optimize the image.
Chapter 3
GelCapture software
About the histogram
3
E
‑
Gel
™
Imager Gel Documentation System User Guide
27
Summary of Contents for E-Gel 4466611
Page 67: ......


