Tables
444
•
Set
Graph <
-
> Table
and Independent by using the
setTable
function. Refer to the
Technical Reference
module.
Displaying an Automatic Table
If
Independent = AUTO
on the
TABLE SETUP
dialog box, a table is generated
automatically when you display the Table screen. If
Graph <
-
> Table
= ON
, the table
matches the trace values from the Graph screen. If
Graph <
-
> Table
= OFF
, the table is
based on the values you entered for
tblStart
and
@
tbl
.
Before You Begin
Define and select the applicable functions on the Y= Editor (
¹ #
). This example uses
y1(x) = x
3
N
x/3
.
Displaying the Table Screen
To display the Table screen, press
¹ '
or
O
5
.
The cursor initially highlights the cell that contains the starting value of the independent
variable. You can move the cursor to any cell that contains a value.
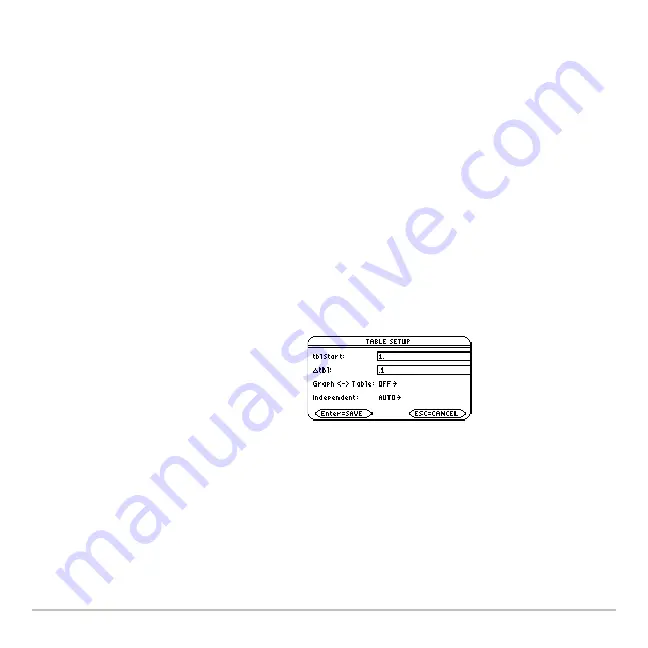
Then enter the initial table parameters
(
¹ &
).
Summary of Contents for Titanium TI-89
Page 9: ...Getting Started 6 TI 89 Titanium keys Ë Ì Í Ê ...
Page 34: ...Getting Started 31 2 or D 2 B u s i n e s s D B D B Press Result ...
Page 43: ...Getting Started 40 3 0 D B D D B D Press Result ...
Page 44: ...Getting Started 41 D 2 0 0 2 D B Scroll down to October and press Press Result ...
Page 58: ...Getting Started 55 Example Set split screen mode to TOP BOTTOM Press Result 3 B D ...
Page 70: ...Getting Started 67 ...
Page 175: ...Operating the Calculator 172 From the Keyboard ...
Page 456: ...Tables 453 ...
Page 527: ...Data Matrix Editor 524 ...


