


3D Graphing
382
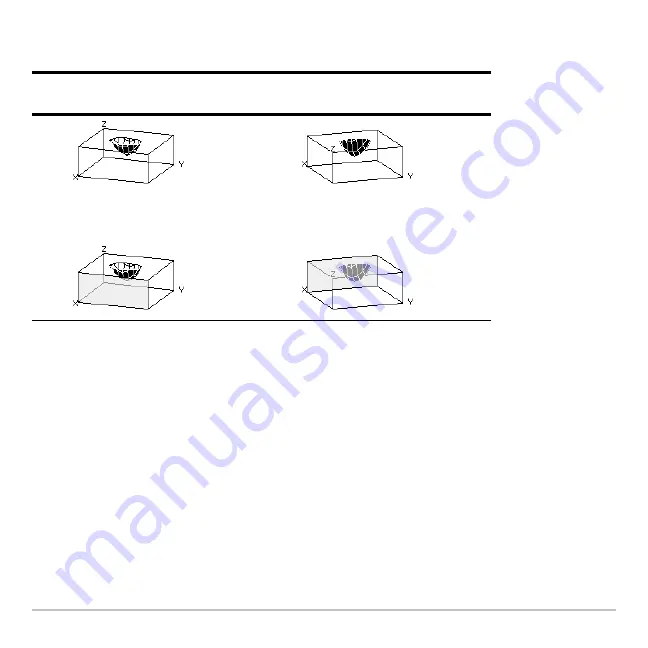
Optical illusions may be more noticeable with box axes. For example, it may not be
immediately obvious which is the “front” of the box.
Note:
The first two examples show the graphs as displayed on the screen. The second
two examples use artificial shading (which is not displayed on the screen) to show the
front of the box.
To minimize the effect of optical illusions, use the GRAPH FORMATS dialog box to set
Style = HIDDEN SURFACE.
Contour Plots
In a contour plot, a line is drawn to connect adjacent points on the 3D graph that have
the same z value. This module discusses the CONTOUR LEVELS and WIRE AND
CONTOUR graph format styles.
Looking down
from above the xy plane
Looking up
from below the xy plane
eye
q
= 20, eye
f
= 55, eye
ψ
= 0
eye
q
= 20, eye
f
= 120, eye
ψ
= 0
Summary of Contents for Titanium TI-89
Page 9: ...Getting Started 6 TI 89 Titanium keys Ë Ì Í Ê ...
Page 34: ...Getting Started 31 2 or D 2 B u s i n e s s D B D B Press Result ...
Page 43: ...Getting Started 40 3 0 D B D D B D Press Result ...
Page 44: ...Getting Started 41 D 2 0 0 2 D B Scroll down to October and press Press Result ...
Page 58: ...Getting Started 55 Example Set split screen mode to TOP BOTTOM Press Result 3 B D ...
Page 70: ...Getting Started 67 ...
Page 175: ...Operating the Calculator 172 From the Keyboard ...
Page 456: ...Tables 453 ...
Page 527: ...Data Matrix Editor 524 ...


