Using Lists & Spreadsheet
561
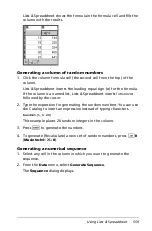
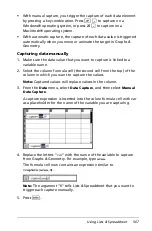
Graphing spreadsheet data
You can graph the data in a spreadsheet using Quick Graph or Summary
Plot. Lists & Spreadsheet cells that contain no data are not represented
by data points on graphs.
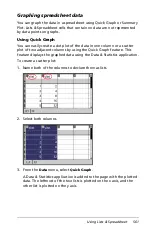
Using Quick Graph
You can easily create a dot plot of the data in one column or a scatter
plot of two adjacent columns by using the Quick Graph feature. This
feature displays the graphed data using the Data & Statistics application.
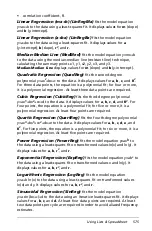
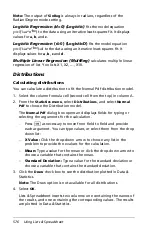
To create a scatter plot:
1. Name both of the columns to declare them as lists.
2. Select both columns.
3. From the
Data
menu, select
Quick Graph
.
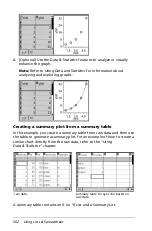
A Data & Statistics application is added to the page with the plotted
data. The leftmost of the two lists is plotted on the x axis, and the
other list is plotted on the y axis.
Summary of Contents for TI-Nspire
Page 38: ...26 Setting up the TI Nspire Navigator Teacher Software ...
Page 46: ...34 Getting started with the TI Nspire Navigator Teacher Software ...
Page 84: ...72 Using the Content Workspace ...
Page 180: ...168 Capturing Screens ...
Page 256: ...244 Embedding documents in web pages ...
Page 336: ...324 Polling students ...
Page 374: ...362 Using the Review Workspace ...
Page 436: ...424 Calculator ...
Page 450: ...438 Using Variables ...
Page 602: ...590 Using Lists Spreadsheet ...
Page 676: ...664 Using Notes You can also change the sample size and restart the sampling ...
Page 684: ...672 Libraries ...
Page 714: ...702 Programming ...
Page 828: ...816 Data Collection and Analysis ...
Page 846: ...834 Regulatory Information ...
Page 848: ...836 ...


