480
Graphs & Geometry
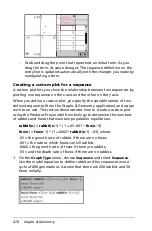
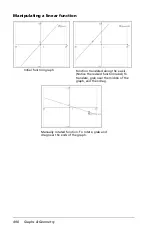
In this example, manipulating the intial term demonstrates that the
point of equilibrium in the rabbit and fox populations over the cycle
of 400 generations = (150, 50).
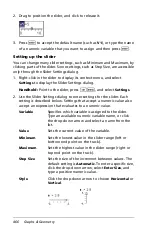
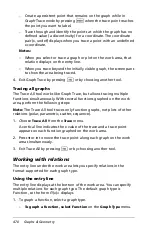
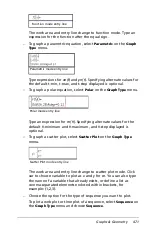
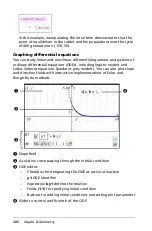
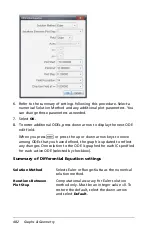
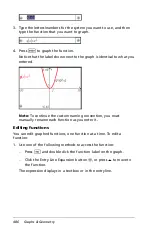
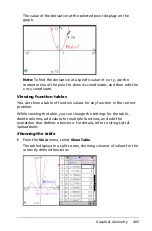
Graphing differential equations
You can study linear and non-linear differential equations and systems of
ordinary differential equations (ODEs), including logistic models and
Lotka-Volterra equations (predator-prey models). You can also plot slope
and direction fields with interactive implementations of Euler and
Runge-Kutta methods.
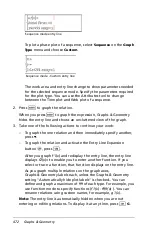
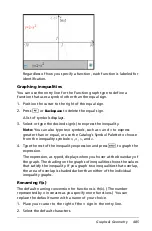
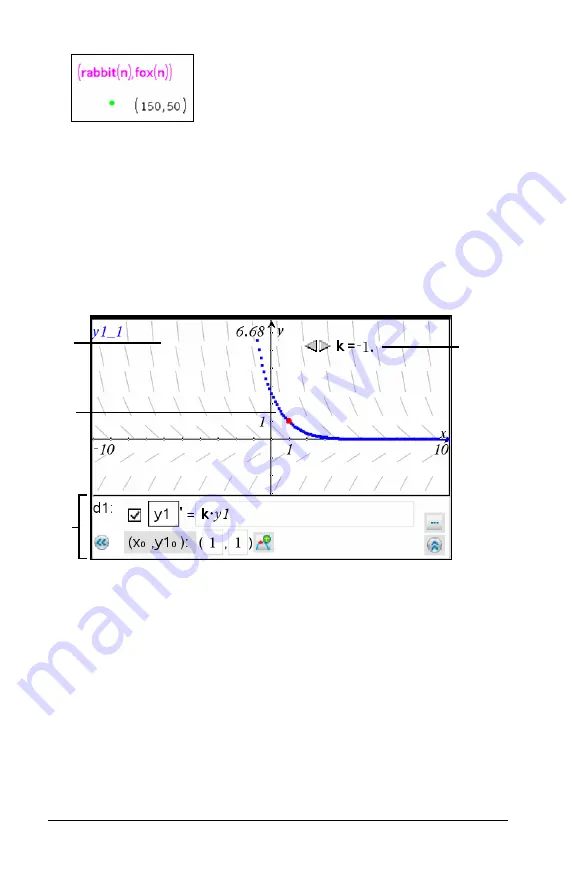
À
Slope field
Á
A solution curve passing through the intitial condition
Â
ODE editor:
–
Checkbox for designating this ODE as active or inactive
–
y1
ODE identifier
–
Expression
k·y1
defines the relation
–
Fields (
1
,
1
) for specifying initial condition
–
Buttons for adding initial conditions and setting plot parameters
Ã
Slider to control coefficient k of the ODE
Â
Á
À
Ã
Summary of Contents for TI-Nspire
Page 38: ...26 Setting up the TI Nspire Navigator Teacher Software ...
Page 46: ...34 Getting started with the TI Nspire Navigator Teacher Software ...
Page 84: ...72 Using the Content Workspace ...
Page 180: ...168 Capturing Screens ...
Page 256: ...244 Embedding documents in web pages ...
Page 336: ...324 Polling students ...
Page 374: ...362 Using the Review Workspace ...
Page 436: ...424 Calculator ...
Page 450: ...438 Using Variables ...
Page 602: ...590 Using Lists Spreadsheet ...
Page 676: ...664 Using Notes You can also change the sample size and restart the sampling ...
Page 684: ...672 Libraries ...
Page 714: ...702 Programming ...
Page 828: ...816 Data Collection and Analysis ...
Page 846: ...834 Regulatory Information ...
Page 848: ...836 ...


