
Using the Review Workspace
345
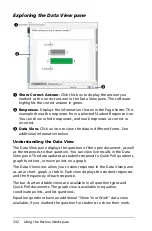
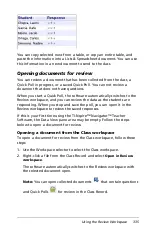
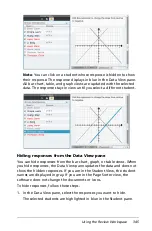
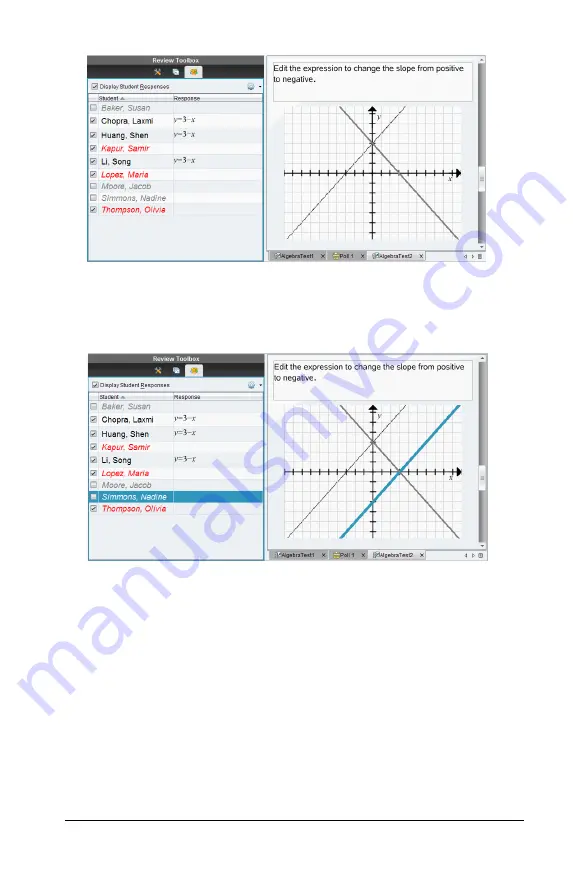
Note
: You can click on a student whose response is hidden to show
their response. The response displays in blue in the Data View pane.
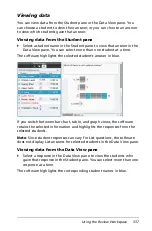
All bar chart, table, and graph views are updated with the selected
data. The response stays in view until you select a different student.
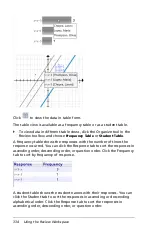
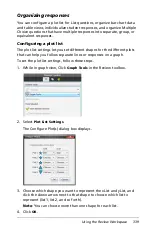
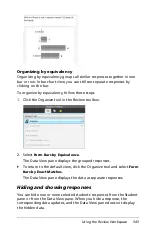
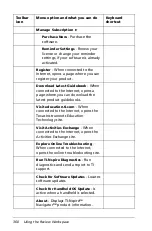
Hiding responses from the Data View pane
You can hide responses from the bar chart, graph, or table views. When
you hide responses, the Data View pane updates the data and does not
show the hidden responses. If you are in the Student View, the student
names are displayed in gray. If you are in the Page Sorter view, the
software does not change the documents or icons.
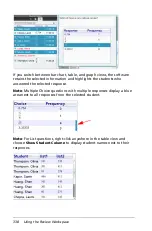
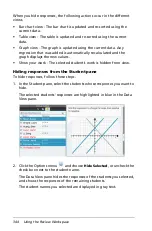
To hide responses, follow these steps.
1. In the Data View pane, select the responses you want to hide.
The selected students are highlighted in blue in the Student pane.
Summary of Contents for TI-Nspire
Page 38: ...26 Setting up the TI Nspire Navigator Teacher Software ...
Page 46: ...34 Getting started with the TI Nspire Navigator Teacher Software ...
Page 84: ...72 Using the Content Workspace ...
Page 180: ...168 Capturing Screens ...
Page 256: ...244 Embedding documents in web pages ...
Page 336: ...324 Polling students ...
Page 374: ...362 Using the Review Workspace ...
Page 436: ...424 Calculator ...
Page 450: ...438 Using Variables ...
Page 602: ...590 Using Lists Spreadsheet ...
Page 676: ...664 Using Notes You can also change the sample size and restart the sampling ...
Page 684: ...672 Libraries ...
Page 714: ...702 Programming ...
Page 828: ...816 Data Collection and Analysis ...
Page 846: ...834 Regulatory Information ...
Page 848: ...836 ...


